posts
Data license: CC-BY
820 rows sorted by id descending
This data as json, CSV (advanced)
Suggested facets: type
| Link | rowid | id ▲ | title | slug | type | status | content | archieml | archieml_update_statistics | published_at | updated_at | gdocSuccessorId | authors | excerpt | created_at_in_wordpress | updated_at_in_wordpress | featured_image | formattingOptions | markdown | wpApiSnapshot |
|---|---|---|---|---|---|---|---|---|---|---|---|---|---|---|---|---|---|---|---|---|
| 1254 | 1254 | 58555 | Tuberculosis | tuberculosis | page | publish | {"id": "wp-58555", "slug": "tuberculosis", "content": {"toc": [], "body": [], "type": "article", "title": "Tuberculosis", "authors": ["Saloni Dattani", "Max Roser"], "dateline": "December 21, 2023", "sidebar-toc": false, "featured-image": ""}, "createdAt": "2023-12-21T13:08:02.000Z", "published": false, "updatedAt": "2023-12-21T18:10:39.000Z", "revisionId": null, "publishedAt": "2023-12-21T13:08:02.000Z", "relatedCharts": [], "publicationContext": "listed"} | {"errors": [], "numBlocks": 0, "numErrors": 0, "wpTagCounts": {}, "htmlTagCounts": {}} | 2023-12-21 13:08:02 | 2024-02-16 14:22:42 | ["Saloni Dattani"] | 2023-12-21 13:08:02 | 2023-12-21 18:10:39 | {} | {"id": 58555, "date": "2023-12-21T13:08:02", "guid": {"rendered": "https://owid.cloud/?page_id=58555"}, "link": "https://owid.cloud/tuberculosis", "meta": {"owid_publication_context_meta_field": [], "owid_key_performance_indicators_meta_field": []}, "slug": "tuberculosis", "tags": [], "type": "page", "title": {"rendered": "Tuberculosis"}, "_links": {"self": [{"href": "https://owid.cloud/wp-json/wp/v2/pages/58555"}], "about": [{"href": "https://owid.cloud/wp-json/wp/v2/types/page"}], "author": [{"href": "https://owid.cloud/wp-json/wp/v2/users/47", "embeddable": true}], "curies": [{"href": "https://api.w.org/{rel}", "name": "wp", "templated": true}], "replies": [{"href": "https://owid.cloud/wp-json/wp/v2/comments?post=58555", "embeddable": true}], "wp:term": [{"href": "https://owid.cloud/wp-json/wp/v2/categories?post=58555", "taxonomy": "category", "embeddable": true}, {"href": "https://owid.cloud/wp-json/wp/v2/tags?post=58555", "taxonomy": "post_tag", "embeddable": true}], "collection": [{"href": "https://owid.cloud/wp-json/wp/v2/pages"}], "wp:attachment": [{"href": "https://owid.cloud/wp-json/wp/v2/media?parent=58555"}], "version-history": [{"href": "https://owid.cloud/wp-json/wp/v2/pages/58555/revisions", "count": 1}], "predecessor-version": [{"id": 58556, "href": "https://owid.cloud/wp-json/wp/v2/pages/58555/revisions/58556"}]}, "author": 47, "parent": 0, "status": "publish", "content": {"rendered": "", "protected": false}, "excerpt": {"rendered": "", "protected": false}, "date_gmt": "2023-12-21T13:08:02", "modified": "2023-12-21T18:10:39", "template": "", "categories": [44, 46], "menu_order": 2, "ping_status": "closed", "authors_name": ["Saloni Dattani"], "modified_gmt": "2023-12-21T18:10:39", "comment_status": "closed", "featured_media": 0, "featured_media_paths": {"thumbnail": null, "medium_large": null}} | |||||
| 1253 | 1253 | 58548 | Help us build a public good for the world: a letter from our founder, Max Roser | help-us-build-public-good-max-letter | post | publish | {"id": "wp-58548", "slug": "help-us-build-public-good-max-letter", "content": {"toc": [], "body": [], "type": "article", "title": "Help us build a public good for the world: a letter from our founder, Max Roser", "authors": ["Max Roser"], "excerpt": "Our small, dedicated team of experts is building more than a website; our ambition is to build a public good for the world. In this letter, we explain why your support is crucial for us to achieve our mission.", "dateline": "September 30, 2023", "subtitle": "Our small, dedicated team of experts is building more than a website; our ambition is to build a public good for the world. In this letter, we explain why your support is crucial for us to achieve our mission.", "sidebar-toc": false, "featured-image": "Thumbnail-Donate-5.png"}, "createdAt": "2023-12-20T22:56:56.000Z", "published": false, "updatedAt": "2023-12-22T16:23:13.000Z", "revisionId": null, "publishedAt": "2023-09-30T09:56:00.000Z", "relatedCharts": [], "publicationContext": "listed"} | {"errors": [], "numBlocks": 0, "numErrors": 0, "wpTagCounts": {}, "htmlTagCounts": {}} | 2023-09-30 09:56:00 | 2024-02-16 14:22:55 | ["Max Roser"] | Our small, dedicated team of experts is building more than a website; our ambition is to build a public good for the world. In this letter, we explain why your support is crucial for us to achieve our mission. | 2023-12-20 22:56:56 | 2023-12-22 16:23:13 | https://ourworldindata.org/wp-content/uploads/2023/12/Thumbnail-Donate-5.png | {} | {"id": 58548, "date": "2023-09-30T10:56:00", "guid": {"rendered": "https://owid.cloud/?p=58548"}, "link": "https://owid.cloud/help-us-build-public-good-max-letter", "meta": {"owid_publication_context_meta_field": {"latest": true, "homepage": true, "immediate_newsletter": true}}, "slug": "help-us-build-public-good-max-letter", "tags": [], "type": "post", "title": {"rendered": "Help us build a public good for the world: a letter from our founder, Max Roser"}, "_links": {"self": [{"href": "https://owid.cloud/wp-json/wp/v2/posts/58548"}], "about": [{"href": "https://owid.cloud/wp-json/wp/v2/types/post"}], "author": [{"href": "https://owid.cloud/wp-json/wp/v2/users/2", "embeddable": true}], "curies": [{"href": "https://api.w.org/{rel}", "name": "wp", "templated": true}], "replies": [{"href": "https://owid.cloud/wp-json/wp/v2/comments?post=58548", "embeddable": true}], "wp:term": [{"href": "https://owid.cloud/wp-json/wp/v2/categories?post=58548", "taxonomy": "category", "embeddable": true}, {"href": "https://owid.cloud/wp-json/wp/v2/tags?post=58548", "taxonomy": "post_tag", "embeddable": true}], "collection": [{"href": "https://owid.cloud/wp-json/wp/v2/posts"}], "wp:attachment": [{"href": "https://owid.cloud/wp-json/wp/v2/media?parent=58548"}], "version-history": [{"href": "https://owid.cloud/wp-json/wp/v2/posts/58548/revisions", "count": 3}], "wp:featuredmedia": [{"href": "https://owid.cloud/wp-json/wp/v2/media/58552", "embeddable": true}], "predecessor-version": [{"id": 58560, "href": "https://owid.cloud/wp-json/wp/v2/posts/58548/revisions/58560"}]}, "author": 2, "format": "standard", "status": "publish", "sticky": false, "content": {"rendered": "", "protected": false}, "excerpt": {"rendered": "Our small, dedicated team of experts is building more than a website; our ambition is to build a public good for the world. In this letter, we explain why your support is crucial for us to achieve our mission.", "protected": false}, "date_gmt": "2023-09-30T09:56:00", "modified": "2023-12-22T16:23:13", "template": "", "categori… | |||
| 1250 | 1250 | 58507 | Cardiovascular Diseases | cardiovascular-diseases | page | publish | {"id": "wp-58507", "slug": "cardiovascular-diseases", "content": {"toc": [], "body": [], "type": "article", "title": "Cardiovascular Diseases", "authors": ["Saloni Dattani", "Max Roser"], "dateline": "December 14, 2023", "sidebar-toc": false, "featured-image": ""}, "createdAt": "2023-12-14T13:06:15.000Z", "published": false, "updatedAt": "2023-12-21T13:08:17.000Z", "revisionId": null, "publishedAt": "2023-12-14T13:06:15.000Z", "relatedCharts": [], "publicationContext": "listed"} | {"errors": [], "numBlocks": 0, "numErrors": 0, "wpTagCounts": {}, "htmlTagCounts": {}} | 2023-12-14 13:06:15 | 2024-02-16 14:22:42 | ["Saloni Dattani"] | 2023-12-14 13:06:15 | 2023-12-21 13:08:17 | {} | {"id": 58507, "date": "2023-12-14T13:06:15", "guid": {"rendered": "https://owid.cloud/?page_id=58507"}, "link": "https://owid.cloud/cardiovascular-diseases", "meta": {"owid_publication_context_meta_field": [], "owid_key_performance_indicators_meta_field": []}, "slug": "cardiovascular-diseases", "tags": [], "type": "page", "title": {"rendered": "Cardiovascular Diseases"}, "_links": {"self": [{"href": "https://owid.cloud/wp-json/wp/v2/pages/58507"}], "about": [{"href": "https://owid.cloud/wp-json/wp/v2/types/page"}], "author": [{"href": "https://owid.cloud/wp-json/wp/v2/users/47", "embeddable": true}], "curies": [{"href": "https://api.w.org/{rel}", "name": "wp", "templated": true}], "replies": [{"href": "https://owid.cloud/wp-json/wp/v2/comments?post=58507", "embeddable": true}], "wp:term": [{"href": "https://owid.cloud/wp-json/wp/v2/categories?post=58507", "taxonomy": "category", "embeddable": true}, {"href": "https://owid.cloud/wp-json/wp/v2/tags?post=58507", "taxonomy": "post_tag", "embeddable": true}], "collection": [{"href": "https://owid.cloud/wp-json/wp/v2/pages"}], "wp:attachment": [{"href": "https://owid.cloud/wp-json/wp/v2/media?parent=58507"}], "version-history": [{"href": "https://owid.cloud/wp-json/wp/v2/pages/58507/revisions", "count": 1}], "predecessor-version": [{"id": 58508, "href": "https://owid.cloud/wp-json/wp/v2/pages/58507/revisions/58508"}]}, "author": 47, "parent": 0, "status": "publish", "content": {"rendered": "", "protected": false}, "excerpt": {"rendered": "", "protected": false}, "date_gmt": "2023-12-14T13:06:15", "modified": "2023-12-21T13:08:17", "template": "", "categories": [44, 46], "menu_order": 5, "ping_status": "closed", "authors_name": ["Saloni Dattani"], "modified_gmt": "2023-12-21T13:08:17", "comment_status": "closed", "featured_media": 0, "featured_media_paths": {"thumbnail": null, "medium_large": null}} | |||||
| 1249 | 1249 | 58499 | Pandemics | pandemics | page | publish | {"id": "wp-58499", "slug": "pandemics", "content": {"toc": [], "body": [], "type": "article", "title": "Pandemics", "authors": ["Saloni Dattani", "Max Roser"], "dateline": "December 7, 2023", "sidebar-toc": false, "featured-image": ""}, "createdAt": "2023-12-07T13:36:30.000Z", "published": false, "updatedAt": "2023-12-07T15:49:41.000Z", "revisionId": null, "publishedAt": "2023-12-07T13:36:30.000Z", "relatedCharts": [], "publicationContext": "listed"} | {"errors": [], "numBlocks": 0, "numErrors": 0, "wpTagCounts": {}, "htmlTagCounts": {}} | 2023-12-07 13:36:30 | 2024-02-16 14:22:42 | ["Saloni Dattani"] | 2023-12-07 13:36:30 | 2023-12-07 15:49:41 | {} | {"id": 58499, "date": "2023-12-07T13:36:30", "guid": {"rendered": "https://owid.cloud/?page_id=58499"}, "link": "https://owid.cloud/pandemics", "meta": {"owid_publication_context_meta_field": [], "owid_key_performance_indicators_meta_field": []}, "slug": "pandemics", "tags": [], "type": "page", "title": {"rendered": "Pandemics"}, "_links": {"self": [{"href": "https://owid.cloud/wp-json/wp/v2/pages/58499"}], "about": [{"href": "https://owid.cloud/wp-json/wp/v2/types/page"}], "author": [{"href": "https://owid.cloud/wp-json/wp/v2/users/47", "embeddable": true}], "curies": [{"href": "https://api.w.org/{rel}", "name": "wp", "templated": true}], "replies": [{"href": "https://owid.cloud/wp-json/wp/v2/comments?post=58499", "embeddable": true}], "wp:term": [{"href": "https://owid.cloud/wp-json/wp/v2/categories?post=58499", "taxonomy": "category", "embeddable": true}, {"href": "https://owid.cloud/wp-json/wp/v2/tags?post=58499", "taxonomy": "post_tag", "embeddable": true}], "collection": [{"href": "https://owid.cloud/wp-json/wp/v2/pages"}], "wp:attachment": [{"href": "https://owid.cloud/wp-json/wp/v2/media?parent=58499"}], "version-history": [{"href": "https://owid.cloud/wp-json/wp/v2/pages/58499/revisions", "count": 1}], "predecessor-version": [{"id": 58500, "href": "https://owid.cloud/wp-json/wp/v2/pages/58499/revisions/58500"}]}, "author": 47, "parent": 0, "status": "publish", "content": {"rendered": "", "protected": false}, "excerpt": {"rendered": "", "protected": false}, "date_gmt": "2023-12-07T13:36:30", "modified": "2023-12-07T15:49:41", "template": "", "categories": [44, 46], "menu_order": 4, "ping_status": "closed", "authors_name": ["Saloni Dattani"], "modified_gmt": "2023-12-07T15:49:41", "comment_status": "closed", "featured_media": 0, "featured_media_paths": {"thumbnail": null, "medium_large": null}} | |||||
| 1248 | 1248 | 58486 | State Capacity | state-capacity | page | publish | <!-- wp:paragraph --> <p>This page is maintained in Google Docs: <a href="https://owid.cloud/admin/gdocs/1RvMWl3OpP6zrygM49jcvI6SotoWWq5er14gLBnPLxUg/preview">https://owid.cloud/admin/gdocs/1RvMWl3OpP6zrygM49jcvI6SotoWWq5er14gLBnPLxUg/preview</a></p> <!-- /wp:paragraph --> |
{"id": "wp-58486", "slug": "state-capacity", "content": {"toc": [], "body": [{"type": "text", "value": [{"text": "This page is maintained in Google Docs: ", "spanType": "span-simple-text"}, {"url": "https://owid.cloud/admin/gdocs/1RvMWl3OpP6zrygM49jcvI6SotoWWq5er14gLBnPLxUg/preview", "children": [{"text": "https://owid.cloud/admin/gdocs/1RvMWl3OpP6zrygM49jcvI6SotoWWq5er14gLBnPLxUg/preview", "spanType": "span-simple-text"}], "spanType": "span-link"}], "parseErrors": []}], "type": "article", "title": "State Capacity", "authors": ["Bastian Herre", "Pablo Arriagada", "Max Roser"], "dateline": "November 30, 2023", "sidebar-toc": false, "featured-image": "state-capacity-featured-image.png"}, "createdAt": "2023-11-28T09:19:26.000Z", "published": false, "updatedAt": "2023-11-30T13:01:41.000Z", "revisionId": null, "publishedAt": "2023-11-30T13:01:40.000Z", "relatedCharts": [], "publicationContext": "listed"} | {"errors": [], "numBlocks": 1, "numErrors": 0, "wpTagCounts": {"paragraph": 1}, "htmlTagCounts": {"p": 1}} | 2023-11-30 13:01:40 | 2024-02-16 14:22:42 | ["Bastian Herre", "Pablo Arriagada"] | 2023-11-28 09:19:26 | 2023-11-30 13:01:41 | https://ourworldindata.org/wp-content/uploads/2023/11/state-capacity-featured-image.png | {} | This page is maintained in Google Docs: [https://owid.cloud/admin/gdocs/1RvMWl3OpP6zrygM49jcvI6SotoWWq5er14gLBnPLxUg/preview](https://owid.cloud/admin/gdocs/1RvMWl3OpP6zrygM49jcvI6SotoWWq5er14gLBnPLxUg/preview) | {"id": 58486, "date": "2023-11-30T13:01:40", "guid": {"rendered": "https://owid.cloud/?page_id=58486"}, "link": "https://owid.cloud/state-capacity", "meta": {"owid_publication_context_meta_field": [], "owid_key_performance_indicators_meta_field": []}, "slug": "state-capacity", "tags": [], "type": "page", "title": {"rendered": "State Capacity"}, "_links": {"self": [{"href": "https://owid.cloud/wp-json/wp/v2/pages/58486"}], "about": [{"href": "https://owid.cloud/wp-json/wp/v2/types/page"}], "author": [{"href": "https://owid.cloud/wp-json/wp/v2/users/49", "embeddable": true}], "curies": [{"href": "https://api.w.org/{rel}", "name": "wp", "templated": true}], "replies": [{"href": "https://owid.cloud/wp-json/wp/v2/comments?post=58486", "embeddable": true}], "wp:term": [{"href": "https://owid.cloud/wp-json/wp/v2/categories?post=58486", "taxonomy": "category", "embeddable": true}, {"href": "https://owid.cloud/wp-json/wp/v2/tags?post=58486", "taxonomy": "post_tag", "embeddable": true}], "collection": [{"href": "https://owid.cloud/wp-json/wp/v2/pages"}], "wp:attachment": [{"href": "https://owid.cloud/wp-json/wp/v2/media?parent=58486"}], "version-history": [{"href": "https://owid.cloud/wp-json/wp/v2/pages/58486/revisions", "count": 1}], "wp:featuredmedia": [{"href": "https://owid.cloud/wp-json/wp/v2/media/58487", "embeddable": true}], "predecessor-version": [{"id": 58488, "href": "https://owid.cloud/wp-json/wp/v2/pages/58486/revisions/58488"}]}, "author": 49, "parent": 0, "status": "publish", "content": {"rendered": "\n<p>This page is maintained in Google Docs: <a href=\"https://owid.cloud/admin/gdocs/1RvMWl3OpP6zrygM49jcvI6SotoWWq5er14gLBnPLxUg/preview\">https://owid.cloud/admin/gdocs/1RvMWl3OpP6zrygM49jcvI6SotoWWq5er14gLBnPLxUg/preview</a></p>\n", "protected": false}, "excerpt": {"rendered": "", "protected": false}, "date_gmt": "2023-11-30T13:01:40", "modified": "2023-11-30T13:01:41", "template": "", "categories": [44, 56, 239, 57, 193], "menu_order": 6, "ping_status": "closed", "authors_name": ["Bastian Herre", "Pablo Ar… | ||
| 1245 | 1245 | 58184 | Animal Welfare Explorer Block | animal-welfare-explorer-block-2 | wp_block | publish | <!-- wp:heading {"level":3} -->
<h3>Explore more of our work on Animal Welfare</h3>
<!-- /wp:heading -->
<!-- wp:owid/prominent-link {"linkUrl":"https://ourworldindata.org/animal-welfare","mediaId":58177,"mediaUrl":"https://owid.cloud/app/uploads/2023/09/animal-welfare-thumbnail.png","mediaAlt":"","className":"is-style-thin"} /--> |
{"id": "wp-58184", "slug": "animal-welfare-explorer-block-2", "content": {"toc": [], "body": [{"text": [{"text": "Explore more of our work on Animal Welfare", "spanType": "span-simple-text"}], "type": "heading", "level": 2, "parseErrors": []}], "type": "article", "title": "Animal Welfare Explorer Block", "authors": [null], "dateline": "September 26, 2023", "sidebar-toc": false, "featured-image": ""}, "createdAt": "2023-09-26T09:56:14.000Z", "published": false, "updatedAt": "2023-09-26T09:56:14.000Z", "revisionId": null, "publishedAt": "2023-09-26T09:56:14.000Z", "relatedCharts": [], "publicationContext": "listed"} | {"errors": [{"name": "prominent link missing title", "details": "Prominent link is missing a title attribute"}], "numBlocks": 1, "numErrors": 1, "wpTagCounts": {"heading": 1, "owid/prominent-link": 1}, "htmlTagCounts": {"h3": 1}} | 2023-09-26 09:56:14 | 2024-02-16 14:23:03 | [null] | 2023-09-26 09:56:14 | {} | ## Explore more of our work on Animal Welfare | {"data": {"wpBlock": {"content": "\n<h3>Explore more of our work on Animal Welfare</h3>\n\n\n <block type=\"prominent-link\" style=\"is-style-thin\">\n <link-url>https://ourworldindata.org/animal-welfare</link-url>\n <title></title>\n <content></content>\n <figure><img width=\"768\" height=\"403\" src=\"https://owid.cloud/app/uploads/2023/09/animal-welfare-thumbnail-768x403.png\" class=\"attachment-medium_large size-medium_large\" alt=\"\" loading=\"lazy\" srcset=\"https://owid.cloud/app/uploads/2023/09/animal-welfare-thumbnail-768x403.png 768w, https://owid.cloud/app/uploads/2023/09/animal-welfare-thumbnail-400x210.png 400w, https://owid.cloud/app/uploads/2023/09/animal-welfare-thumbnail-800x420.png 800w, https://owid.cloud/app/uploads/2023/09/animal-welfare-thumbnail-150x79.png 150w, https://owid.cloud/app/uploads/2023/09/animal-welfare-thumbnail.png 1200w\" sizes=\"(max-width: 768px) 100vw, 768px\" /></figure>\n </block>"}}, "extensions": {"debug": [{"type": "DEBUG_LOGS_INACTIVE", "message": "GraphQL Debug logging is not active. To see debug logs, GRAPHQL_DEBUG must be enabled."}]}} | ||||
| 1243 | 1243 | 58173 | Animal Welfare | animal-welfare | page | publish | {"id": "wp-58173", "slug": "animal-welfare", "content": {"toc": [], "body": [], "type": "article", "title": "Animal Welfare", "authors": ["Hannah Ritchie", "Max Roser"], "dateline": "September 26, 2023", "sidebar-toc": false, "featured-image": ""}, "createdAt": "2023-09-26T10:25:51.000Z", "published": false, "updatedAt": "2023-09-26T09:25:53.000Z", "revisionId": null, "publishedAt": "2023-09-26T09:25:51.000Z", "relatedCharts": [], "publicationContext": "listed"} | {"errors": [], "numBlocks": 0, "numErrors": 0, "wpTagCounts": {}, "htmlTagCounts": {}} | 2023-09-26 09:25:51 | 2024-02-16 14:22:42 | ["Hannah Ritchie"] | 2023-09-26 10:25:51 | 2023-09-26 09:25:53 | {} | {"id": 58173, "date": "2023-09-26T10:25:51", "guid": {"rendered": "https://owid.cloud/?page_id=58173"}, "link": "https://owid.cloud/animal-welfare", "meta": {"owid_publication_context_meta_field": [], "owid_key_performance_indicators_meta_field": []}, "slug": "animal-welfare", "tags": [], "type": "page", "title": {"rendered": "Animal Welfare"}, "_links": {"self": [{"href": "https://owid.cloud/wp-json/wp/v2/pages/58173"}], "about": [{"href": "https://owid.cloud/wp-json/wp/v2/types/page"}], "author": [{"href": "https://owid.cloud/wp-json/wp/v2/users/17", "embeddable": true}], "curies": [{"href": "https://api.w.org/{rel}", "name": "wp", "templated": true}], "replies": [{"href": "https://owid.cloud/wp-json/wp/v2/comments?post=58173", "embeddable": true}], "wp:term": [{"href": "https://owid.cloud/wp-json/wp/v2/categories?post=58173", "taxonomy": "category", "embeddable": true}, {"href": "https://owid.cloud/wp-json/wp/v2/tags?post=58173", "taxonomy": "post_tag", "embeddable": true}], "collection": [{"href": "https://owid.cloud/wp-json/wp/v2/pages"}], "wp:attachment": [{"href": "https://owid.cloud/wp-json/wp/v2/media?parent=58173"}], "version-history": [{"href": "https://owid.cloud/wp-json/wp/v2/pages/58173/revisions", "count": 1}], "predecessor-version": [{"id": 58174, "href": "https://owid.cloud/wp-json/wp/v2/pages/58173/revisions/58174"}]}, "author": 17, "parent": 0, "status": "publish", "content": {"rendered": "", "protected": false}, "excerpt": {"rendered": "", "protected": false}, "date_gmt": "2023-09-26T09:25:51", "modified": "2023-09-26T10:25:53", "template": "", "categories": [44, 47], "menu_order": 8, "ping_status": "closed", "authors_name": ["Hannah Ritchie"], "modified_gmt": "2023-09-26T09:25:53", "comment_status": "closed", "featured_media": 0, "featured_media_paths": {"thumbnail": null, "medium_large": null}} | |||||
| 1242 | 1242 | 57910 | We published a new topic page on homicides | homicides-redesign | post | publish | {"id": "wp-57910", "slug": "homicides-redesign", "content": {"toc": [], "body": [], "type": "article", "title": "We published a new topic page on homicides", "authors": ["Bastian Herre", "Fiona Spooner"], "excerpt": "Explore data on homicides rates across the world, and how these have changed over time.", "dateline": "July 20, 2023", "subtitle": "Explore data on homicides rates across the world, and how these have changed over time.", "sidebar-toc": false, "featured-image": "Homicides.png"}, "createdAt": "2023-07-20T10:36:58.000Z", "published": false, "updatedAt": "2023-10-24T09:45:27.000Z", "revisionId": null, "publishedAt": "2023-07-20T09:36:58.000Z", "relatedCharts": [], "publicationContext": "listed"} | {"errors": [], "numBlocks": 0, "numErrors": 0, "wpTagCounts": {}, "htmlTagCounts": {}} | 2023-07-20 09:36:58 | 2024-02-16 14:22:55 | ["Bastian Herre", "Fiona Spooner"] | Explore data on homicides rates across the world, and how these have changed over time. | 2023-07-20 10:36:58 | 2023-10-24 09:45:27 | https://ourworldindata.org/wp-content/uploads/2023/06/Homicides.png | {} | {"id": 57910, "date": "2023-07-20T10:36:58", "guid": {"rendered": "https://owid.cloud/?p=57910"}, "link": "https://owid.cloud/homicides-redesign", "meta": {"owid_publication_context_meta_field": {"latest": true, "homepage": true, "immediate_newsletter": true}}, "slug": "homicides-redesign", "tags": [], "type": "post", "title": {"rendered": "We published a new topic page on homicides"}, "_links": {"self": [{"href": "https://owid.cloud/wp-json/wp/v2/posts/57910"}], "about": [{"href": "https://owid.cloud/wp-json/wp/v2/types/post"}], "author": [{"href": "https://owid.cloud/wp-json/wp/v2/users/49", "embeddable": true}], "curies": [{"href": "https://api.w.org/{rel}", "name": "wp", "templated": true}], "replies": [{"href": "https://owid.cloud/wp-json/wp/v2/comments?post=57910", "embeddable": true}], "wp:term": [{"href": "https://owid.cloud/wp-json/wp/v2/categories?post=57910", "taxonomy": "category", "embeddable": true}, {"href": "https://owid.cloud/wp-json/wp/v2/tags?post=57910", "taxonomy": "post_tag", "embeddable": true}], "collection": [{"href": "https://owid.cloud/wp-json/wp/v2/posts"}], "wp:attachment": [{"href": "https://owid.cloud/wp-json/wp/v2/media?parent=57910"}], "version-history": [{"href": "https://owid.cloud/wp-json/wp/v2/posts/57910/revisions", "count": 8}], "wp:featuredmedia": [{"href": "https://owid.cloud/wp-json/wp/v2/media/57347", "embeddable": true}], "predecessor-version": [{"id": 58391, "href": "https://owid.cloud/wp-json/wp/v2/posts/57910/revisions/58391"}]}, "author": 49, "format": "standard", "status": "publish", "sticky": false, "content": {"rendered": "", "protected": false}, "excerpt": {"rendered": "Explore data on homicides rates across the world, and how these have changed over time.", "protected": false}, "date_gmt": "2023-07-20T09:36:58", "modified": "2023-10-24T10:45:27", "template": "", "categories": [1], "ping_status": "closed", "authors_name": ["Bastian Herre", "Fiona Spooner"], "modified_gmt": "2023-10-24T09:45:27", "comment_status": "closed", "featured_media": 57347, "featured_medi… | |||
| 1241 | 1241 | 57862 | We published a new topic page on economic growth | economic-growth-redesign | post | publish | {"id": "wp-57862", "slug": "economic-growth-redesign", "content": {"toc": [], "body": [], "type": "article", "title": "We published a new topic page on economic growth", "authors": ["Joe Hasell", "Pablo Arriagada"], "excerpt": "Explore global data on the history of economic growth, and differences across the world today.", "dateline": "July 14, 2023", "subtitle": "Explore global data on the history of economic growth, and differences across the world today.", "sidebar-toc": false, "featured-image": "economic-growth-topic-page-featured-image.png"}, "createdAt": "2023-07-14T08:19:10.000Z", "published": false, "updatedAt": "2023-10-24T09:44:41.000Z", "revisionId": null, "publishedAt": "2023-07-14T09:30:00.000Z", "relatedCharts": [], "publicationContext": "listed"} | {"errors": [], "numBlocks": 0, "numErrors": 0, "wpTagCounts": {}, "htmlTagCounts": {}} | 2023-07-14 09:30:00 | 2024-02-16 14:22:55 | ["Joe Hasell", "Pablo Arriagada"] | Explore global data on the history of economic growth, and differences across the world today. | 2023-07-14 08:19:10 | 2023-10-24 09:44:41 | https://ourworldindata.org/wp-content/uploads/2023/07/economic-growth-topic-page-featured-image.png | {} | {"id": 57862, "date": "2023-07-14T10:30:00", "guid": {"rendered": "https://owid.cloud/?p=57862"}, "link": "https://owid.cloud/economic-growth-redesign", "meta": {"owid_publication_context_meta_field": {"latest": true, "homepage": true, "immediate_newsletter": true}}, "slug": "economic-growth-redesign", "tags": [], "type": "post", "title": {"rendered": "We published a new topic page on economic growth"}, "_links": {"self": [{"href": "https://owid.cloud/wp-json/wp/v2/posts/57862"}], "about": [{"href": "https://owid.cloud/wp-json/wp/v2/types/post"}], "author": [{"href": "https://owid.cloud/wp-json/wp/v2/users/14", "embeddable": true}], "curies": [{"href": "https://api.w.org/{rel}", "name": "wp", "templated": true}], "replies": [{"href": "https://owid.cloud/wp-json/wp/v2/comments?post=57862", "embeddable": true}], "wp:term": [{"href": "https://owid.cloud/wp-json/wp/v2/categories?post=57862", "taxonomy": "category", "embeddable": true}, {"href": "https://owid.cloud/wp-json/wp/v2/tags?post=57862", "taxonomy": "post_tag", "embeddable": true}], "collection": [{"href": "https://owid.cloud/wp-json/wp/v2/posts"}], "wp:attachment": [{"href": "https://owid.cloud/wp-json/wp/v2/media?parent=57862"}], "version-history": [{"href": "https://owid.cloud/wp-json/wp/v2/posts/57862/revisions", "count": 5}], "wp:featuredmedia": [{"href": "https://owid.cloud/wp-json/wp/v2/media/57865", "embeddable": true}], "predecessor-version": [{"id": 58388, "href": "https://owid.cloud/wp-json/wp/v2/posts/57862/revisions/58388"}]}, "author": 14, "format": "standard", "status": "publish", "sticky": false, "content": {"rendered": "", "protected": false}, "excerpt": {"rendered": "Explore global data on the history of economic growth, and differences across the world today.", "protected": false}, "date_gmt": "2023-07-14T09:30:00", "modified": "2023-10-24T10:44:41", "template": "", "categories": [189, 1], "ping_status": "closed", "authors_name": ["Joe Hasell", "Pablo Arriagada"], "modified_gmt": "2023-10-24T09:44:41", "comment_status": "closed", "featured_… | |||
| 1240 | 1240 | 57830 | The world has passed "peak child" | population-growth-redesign | post | publish | {"id": "wp-57830", "slug": "population-growth-redesign", "content": {"toc": [], "body": [], "type": "article", "title": "The world has passed \"peak child\"", "authors": ["Hannah Ritchie", "Lucas Rodés-Guirao"], "excerpt": "Explore global and country data on population growth, demography, and how this is changing.", "dateline": "July 11, 2023", "subtitle": "Explore global and country data on population growth, demography, and how this is changing.", "sidebar-toc": false, "featured-image": "World-Population-Growth.png"}, "createdAt": "2023-07-11T10:14:23.000Z", "published": false, "updatedAt": "2024-02-12T18:05:42.000Z", "revisionId": null, "publishedAt": "2023-07-11T09:14:23.000Z", "relatedCharts": [], "publicationContext": "listed"} | {"errors": [], "numBlocks": 0, "numErrors": 0, "wpTagCounts": {}, "htmlTagCounts": {}} | 2023-07-11 09:14:23 | 2024-02-16 14:22:55 | ["Hannah Ritchie", "Lucas Rodés-Guirao"] | Explore global and country data on population growth, demography, and how this is changing. | 2023-07-11 10:14:23 | 2024-02-12 18:05:42 | https://ourworldindata.org/wp-content/uploads/2023/07/World-Population-Growth.png | {} | {"id": 57830, "date": "2023-07-11T10:14:23", "guid": {"rendered": "https://owid.cloud/?p=57830"}, "link": "https://owid.cloud/population-growth-redesign", "meta": {"owid_publication_context_meta_field": {"latest": true, "homepage": true, "immediate_newsletter": true}}, "slug": "population-growth-redesign", "tags": [], "type": "post", "title": {"rendered": "The world has passed “peak child”"}, "_links": {"self": [{"href": "https://owid.cloud/wp-json/wp/v2/posts/57830"}], "about": [{"href": "https://owid.cloud/wp-json/wp/v2/types/post"}], "author": [{"href": "https://owid.cloud/wp-json/wp/v2/users/17", "embeddable": true}], "curies": [{"href": "https://api.w.org/{rel}", "name": "wp", "templated": true}], "replies": [{"href": "https://owid.cloud/wp-json/wp/v2/comments?post=57830", "embeddable": true}], "wp:term": [{"href": "https://owid.cloud/wp-json/wp/v2/categories?post=57830", "taxonomy": "category", "embeddable": true}, {"href": "https://owid.cloud/wp-json/wp/v2/tags?post=57830", "taxonomy": "post_tag", "embeddable": true}], "collection": [{"href": "https://owid.cloud/wp-json/wp/v2/posts"}], "wp:attachment": [{"href": "https://owid.cloud/wp-json/wp/v2/media?parent=57830"}], "version-history": [{"href": "https://owid.cloud/wp-json/wp/v2/posts/57830/revisions", "count": 6}], "wp:featuredmedia": [{"href": "https://owid.cloud/wp-json/wp/v2/media/57836", "embeddable": true}], "predecessor-version": [{"id": 58686, "href": "https://owid.cloud/wp-json/wp/v2/posts/57830/revisions/58686"}]}, "author": 17, "format": "standard", "status": "publish", "sticky": false, "content": {"rendered": "", "protected": false}, "excerpt": {"rendered": "Explore global and country data on population growth, demography, and how this is changing.", "protected": false}, "date_gmt": "2023-07-11T09:14:23", "modified": "2024-02-12T18:05:42", "template": "", "categories": [1], "ping_status": "closed", "authors_name": ["Hannah Ritchie", "Lucas Rodés-Guirao"], "modified_gmt": "2024-02-12T18:05:42", "comment_status": "closed", "featured_… | |||
| 1239 | 1239 | 57818 | We just redesigned our work on Waste Management | waste-management-redesign | post | publish | {"id": "wp-57818", "slug": "waste-management-redesign", "content": {"toc": [], "body": [], "type": "article", "title": "We just redesigned our work on Waste Management", "authors": ["Hannah Ritchie", "Edouard Mathieu"], "excerpt": "Explore data visualizations on waste management.", "dateline": "February 23, 2023", "subtitle": "Explore data visualizations on waste management.", "sidebar-toc": false, "featured-image": "Waste-Management.png"}, "createdAt": "2023-07-10T18:01:50.000Z", "published": false, "updatedAt": "2023-07-10T17:33:28.000Z", "revisionId": null, "publishedAt": "2023-02-23T18:00:00.000Z", "relatedCharts": [], "publicationContext": "listed"} | {"errors": [], "numBlocks": 0, "numErrors": 0, "wpTagCounts": {}, "htmlTagCounts": {}} | 2023-02-23 18:00:00 | 2024-02-16 14:22:54 | ["Hannah Ritchie", "Edouard Mathieu"] | Explore data visualizations on waste management. | 2023-07-10 18:01:50 | 2023-07-10 17:33:28 | https://ourworldindata.org/wp-content/uploads/2023/02/Waste-Management.png | {} | {"id": 57818, "date": "2023-02-23T18:00:00", "guid": {"rendered": "https://owid.cloud/?p=57818"}, "link": "https://owid.cloud/waste-management-redesign", "meta": {"owid_publication_context_meta_field": {"latest": true, "homepage": true, "immediate_newsletter": true}}, "slug": "waste-management-redesign", "tags": [], "type": "post", "title": {"rendered": "We just redesigned our work on Waste Management"}, "_links": {"self": [{"href": "https://owid.cloud/wp-json/wp/v2/posts/57818"}], "about": [{"href": "https://owid.cloud/wp-json/wp/v2/types/post"}], "author": [{"href": "https://owid.cloud/wp-json/wp/v2/users/17", "embeddable": true}], "curies": [{"href": "https://api.w.org/{rel}", "name": "wp", "templated": true}], "replies": [{"href": "https://owid.cloud/wp-json/wp/v2/comments?post=57818", "embeddable": true}], "wp:term": [{"href": "https://owid.cloud/wp-json/wp/v2/categories?post=57818", "taxonomy": "category", "embeddable": true}, {"href": "https://owid.cloud/wp-json/wp/v2/tags?post=57818", "taxonomy": "post_tag", "embeddable": true}], "collection": [{"href": "https://owid.cloud/wp-json/wp/v2/posts"}], "wp:attachment": [{"href": "https://owid.cloud/wp-json/wp/v2/media?parent=57818"}], "version-history": [{"href": "https://owid.cloud/wp-json/wp/v2/posts/57818/revisions", "count": 2}], "wp:featuredmedia": [{"href": "https://owid.cloud/wp-json/wp/v2/media/56040", "embeddable": true}], "predecessor-version": [{"id": 57820, "href": "https://owid.cloud/wp-json/wp/v2/posts/57818/revisions/57820"}]}, "author": 17, "format": "standard", "status": "publish", "sticky": false, "content": {"rendered": "", "protected": false}, "excerpt": {"rendered": "Explore data visualizations on waste management.", "protected": false}, "date_gmt": "2023-02-23T18:00:00", "modified": "2023-07-10T18:33:28", "template": "", "categories": [1], "ping_status": "closed", "authors_name": ["Hannah Ritchie", "Edouard Mathieu"], "modified_gmt": "2023-07-10T17:33:28", "comment_status": "closed", "featured_media": 56040, "featured_media_paths": {"thumb… | |||
| 1238 | 1238 | 57814 | We published a redesign of our work on Light at Night | light-at-night-redesign | post | publish | {"id": "wp-57814", "slug": "light-at-night-redesign", "content": {"toc": [], "body": [], "type": "article", "title": "We published a redesign of our work on Light at Night", "authors": ["Max Roser", "Hannah Ritchie"], "excerpt": "On this page, you can find data, visualizations, and writing about changes in efficiency, price, and access to lighting.", "dateline": "February 10, 2023", "subtitle": "On this page, you can find data, visualizations, and writing about changes in efficiency, price, and access to lighting.", "sidebar-toc": false, "featured-image": "Light-at-Night.png"}, "createdAt": "2023-07-10T17:13:34.000Z", "published": false, "updatedAt": "2023-07-10T17:12:45.000Z", "revisionId": null, "publishedAt": "2023-02-10T16:58:00.000Z", "relatedCharts": [], "publicationContext": "listed"} | {"errors": [], "numBlocks": 0, "numErrors": 0, "wpTagCounts": {}, "htmlTagCounts": {}} | 2023-02-10 16:58:00 | 2024-02-16 14:22:54 | ["Max Roser", "Hannah Ritchie"] | On this page, you can find data, visualizations, and writing about changes in efficiency, price, and access to lighting. | 2023-07-10 17:13:34 | 2023-07-10 17:12:45 | https://ourworldindata.org/wp-content/uploads/2023/02/Light-at-Night.png | {} | {"id": 57814, "date": "2023-02-10T16:58:00", "guid": {"rendered": "https://owid.cloud/?p=57814"}, "link": "https://owid.cloud/light-at-night-redesign", "meta": {"owid_publication_context_meta_field": {"latest": true, "homepage": true, "immediate_newsletter": true}}, "slug": "light-at-night-redesign", "tags": [], "type": "post", "title": {"rendered": "We published a redesign of our work on Light at Night"}, "_links": {"self": [{"href": "https://owid.cloud/wp-json/wp/v2/posts/57814"}], "about": [{"href": "https://owid.cloud/wp-json/wp/v2/types/post"}], "author": [{"href": "https://owid.cloud/wp-json/wp/v2/users/2", "embeddable": true}], "curies": [{"href": "https://api.w.org/{rel}", "name": "wp", "templated": true}], "replies": [{"href": "https://owid.cloud/wp-json/wp/v2/comments?post=57814", "embeddable": true}], "wp:term": [{"href": "https://owid.cloud/wp-json/wp/v2/categories?post=57814", "taxonomy": "category", "embeddable": true}, {"href": "https://owid.cloud/wp-json/wp/v2/tags?post=57814", "taxonomy": "post_tag", "embeddable": true}], "collection": [{"href": "https://owid.cloud/wp-json/wp/v2/posts"}], "wp:attachment": [{"href": "https://owid.cloud/wp-json/wp/v2/media?parent=57814"}], "version-history": [{"href": "https://owid.cloud/wp-json/wp/v2/posts/57814/revisions", "count": 2}], "wp:featuredmedia": [{"href": "https://owid.cloud/wp-json/wp/v2/media/55687", "embeddable": true}], "predecessor-version": [{"id": 57817, "href": "https://owid.cloud/wp-json/wp/v2/posts/57814/revisions/57817"}]}, "author": 2, "format": "standard", "status": "publish", "sticky": false, "content": {"rendered": "", "protected": false}, "excerpt": {"rendered": "On this page, you can find data, visualizations, and writing about changes in efficiency, price, and access to lighting.", "protected": false}, "date_gmt": "2023-02-10T16:58:00", "modified": "2023-07-10T18:12:45", "template": "", "categories": [1], "ping_status": "closed", "authors_name": ["Max Roser", "Hannah Ritchie"], "modified_gmt": "2023-07-10T17:12:45", "comment_status": … | |||
| 1237 | 1237 | 57811 | We published a redesign of our work on Food Prices | food-prices-redesign | post | publish | {"id": "wp-57811", "slug": "food-prices-redesign", "content": {"toc": [], "body": [], "type": "article", "title": "We published a redesign of our work on Food Prices", "authors": ["Max Roser", "Hannah Ritchie"], "excerpt": "On this page, you can find data, visualizations, and writing on global and country-level food prices and expenditures, the affordability of food, and how this has changed over time.", "dateline": "January 19, 2023", "subtitle": "On this page, you can find data, visualizations, and writing on global and country-level food prices and expenditures, the affordability of food, and how this has changed over time.", "sidebar-toc": false, "featured-image": "Food-Prices.png"}, "createdAt": "2023-07-10T16:19:54.000Z", "published": false, "updatedAt": "2023-07-10T16:13:58.000Z", "revisionId": null, "publishedAt": "2023-01-19T16:15:00.000Z", "relatedCharts": [], "publicationContext": "listed"} | {"errors": [], "numBlocks": 0, "numErrors": 0, "wpTagCounts": {}, "htmlTagCounts": {}} | 2023-01-19 16:15:00 | 2024-02-16 14:22:54 | ["Max Roser", "Hannah Ritchie"] | On this page, you can find data, visualizations, and writing on global and country-level food prices and expenditures, the affordability of food, and how this has changed over time. | 2023-07-10 16:19:54 | 2023-07-10 16:13:58 | https://ourworldindata.org/wp-content/uploads/2023/01/Food-Prices.png | {} | {"id": 57811, "date": "2023-01-19T16:15:00", "guid": {"rendered": "https://owid.cloud/?p=57811"}, "link": "https://owid.cloud/food-prices-redesign", "meta": {"owid_publication_context_meta_field": {"latest": true, "homepage": true, "immediate_newsletter": true}}, "slug": "food-prices-redesign", "tags": [], "type": "post", "title": {"rendered": "We published a redesign of our work on Food Prices"}, "_links": {"self": [{"href": "https://owid.cloud/wp-json/wp/v2/posts/57811"}], "about": [{"href": "https://owid.cloud/wp-json/wp/v2/types/post"}], "author": [{"href": "https://owid.cloud/wp-json/wp/v2/users/2", "embeddable": true}], "curies": [{"href": "https://api.w.org/{rel}", "name": "wp", "templated": true}], "replies": [{"href": "https://owid.cloud/wp-json/wp/v2/comments?post=57811", "embeddable": true}], "wp:term": [{"href": "https://owid.cloud/wp-json/wp/v2/categories?post=57811", "taxonomy": "category", "embeddable": true}, {"href": "https://owid.cloud/wp-json/wp/v2/tags?post=57811", "taxonomy": "post_tag", "embeddable": true}], "collection": [{"href": "https://owid.cloud/wp-json/wp/v2/posts"}], "wp:attachment": [{"href": "https://owid.cloud/wp-json/wp/v2/media?parent=57811"}], "version-history": [{"href": "https://owid.cloud/wp-json/wp/v2/posts/57811/revisions", "count": 2}], "wp:featuredmedia": [{"href": "https://owid.cloud/wp-json/wp/v2/media/55529", "embeddable": true}], "predecessor-version": [{"id": 57813, "href": "https://owid.cloud/wp-json/wp/v2/posts/57811/revisions/57813"}]}, "author": 2, "format": "standard", "status": "publish", "sticky": false, "content": {"rendered": "", "protected": false}, "excerpt": {"rendered": "On this page, you can find data, visualizations, and writing on global and country-level food prices and expenditures, the affordability of food, and how this has changed over time.", "protected": false}, "date_gmt": "2023-01-19T16:15:00", "modified": "2023-07-10T17:13:58", "template": "", "categories": [1], "ping_status": "closed", "authors_name": ["Max Roser", "Hannah Ritchie"], "modi… | |||
| 1236 | 1236 | 57808 | We redesigned our work on Military Personnel and Spending | military-personnel-spending-redesign | post | publish | {"id": "wp-57808", "slug": "military-personnel-spending-redesign", "content": {"toc": [], "body": [], "type": "article", "title": "We redesigned our work on Military Personnel and Spending", "authors": ["Max Roser", "Esteban Ortiz-Ospina", "Hannah Ritchie", "Edouard Mathieu", "Bastian Herre"], "excerpt": "Explore global data and visualizations on military personnel and spending on this page.", "dateline": "January 13, 2023", "subtitle": "Explore global data and visualizations on military personnel and spending on this page.", "sidebar-toc": false, "featured-image": "military-spending-thumbnail.png"}, "createdAt": "2023-07-10T16:07:46.000Z", "published": false, "updatedAt": "2023-07-10T15:52:08.000Z", "revisionId": null, "publishedAt": "2023-01-13T16:06:00.000Z", "relatedCharts": [], "publicationContext": "listed"} | {"errors": [], "numBlocks": 0, "numErrors": 0, "wpTagCounts": {}, "htmlTagCounts": {}} | 2023-01-13 16:06:00 | 2024-02-16 14:22:54 | ["Max Roser", "Esteban Ortiz-Ospina", "Hannah Ritchie", "Edouard Mathieu", "Bastian Herre"] | Explore global data and visualizations on military personnel and spending on this page. | 2023-07-10 16:07:46 | 2023-07-10 15:52:08 | https://ourworldindata.org/wp-content/uploads/2022/02/military-spending-thumbnail.png | {} | {"id": 57808, "date": "2023-01-13T16:06:00", "guid": {"rendered": "https://owid.cloud/?p=57808"}, "link": "https://owid.cloud/military-personnel-spending-redesign", "meta": {"owid_publication_context_meta_field": {"latest": true, "homepage": true, "immediate_newsletter": true}}, "slug": "military-personnel-spending-redesign", "tags": [], "type": "post", "title": {"rendered": "We redesigned our work on Military Personnel and Spending"}, "_links": {"self": [{"href": "https://owid.cloud/wp-json/wp/v2/posts/57808"}], "about": [{"href": "https://owid.cloud/wp-json/wp/v2/types/post"}], "author": [{"href": "https://owid.cloud/wp-json/wp/v2/users/2", "embeddable": true}], "curies": [{"href": "https://api.w.org/{rel}", "name": "wp", "templated": true}], "replies": [{"href": "https://owid.cloud/wp-json/wp/v2/comments?post=57808", "embeddable": true}], "wp:term": [{"href": "https://owid.cloud/wp-json/wp/v2/categories?post=57808", "taxonomy": "category", "embeddable": true}, {"href": "https://owid.cloud/wp-json/wp/v2/tags?post=57808", "taxonomy": "post_tag", "embeddable": true}], "collection": [{"href": "https://owid.cloud/wp-json/wp/v2/posts"}], "wp:attachment": [{"href": "https://owid.cloud/wp-json/wp/v2/media?parent=57808"}], "version-history": [{"href": "https://owid.cloud/wp-json/wp/v2/posts/57808/revisions", "count": 2}], "wp:featuredmedia": [{"href": "https://owid.cloud/wp-json/wp/v2/media/49573", "embeddable": true}], "predecessor-version": [{"id": 57810, "href": "https://owid.cloud/wp-json/wp/v2/posts/57808/revisions/57810"}]}, "author": 2, "format": "standard", "status": "publish", "sticky": false, "content": {"rendered": "", "protected": false}, "excerpt": {"rendered": "Explore global data and visualizations on military personnel and spending on this page.", "protected": false}, "date_gmt": "2023-01-13T16:06:00", "modified": "2023-07-10T16:52:08", "template": "", "categories": [1], "ping_status": "closed", "authors_name": ["Max Roser", "Esteban Ortiz-Ospina", "Hannah Ritchie", "Edouard Mathieu", "Bastian Herre"], … | |||
| 1235 | 1235 | 57804 | We just published a redesign of our work on Tourism | tourism-redesign | post | publish | {"id": "wp-57804", "slug": "tourism-redesign", "content": {"toc": [], "body": [], "type": "article", "title": "We just published a redesign of our work on Tourism", "authors": ["Bastian Herre", "Veronika Samborska", "Max Roser"], "excerpt": "Tourism has massively increased in recent decades. Explore data and visualizations on the history and current state of tourism across the world on this page.", "dateline": "January 9, 2023", "subtitle": "Tourism has massively increased in recent decades. Explore data and visualizations on the history and current state of tourism across the world on this page.", "sidebar-toc": false, "featured-image": "Tourism.png"}, "createdAt": "2023-07-10T15:31:19.000Z", "published": false, "updatedAt": "2023-07-10T15:05:27.000Z", "revisionId": null, "publishedAt": "2023-01-09T15:30:00.000Z", "relatedCharts": [], "publicationContext": "listed"} | {"errors": [], "numBlocks": 0, "numErrors": 0, "wpTagCounts": {}, "htmlTagCounts": {}} | 2023-01-09 15:30:00 | 2024-02-16 14:22:54 | ["Bastian Herre", "Veronika Samborska", "Max Roser"] | Tourism has massively increased in recent decades. Explore data and visualizations on the history and current state of tourism across the world on this page. | 2023-07-10 15:31:19 | 2023-07-10 15:05:27 | https://ourworldindata.org/wp-content/uploads/2023/06/Tourism.png | {} | {"id": 57804, "date": "2023-01-09T15:30:00", "guid": {"rendered": "https://owid.cloud/?p=57804"}, "link": "https://owid.cloud/tourism-redesign", "meta": {"owid_publication_context_meta_field": {"latest": true, "homepage": true, "immediate_newsletter": true}}, "slug": "tourism-redesign", "tags": [], "type": "post", "title": {"rendered": "We just published a redesign of our work on Tourism"}, "_links": {"self": [{"href": "https://owid.cloud/wp-json/wp/v2/posts/57804"}], "about": [{"href": "https://owid.cloud/wp-json/wp/v2/types/post"}], "author": [{"href": "https://owid.cloud/wp-json/wp/v2/users/49", "embeddable": true}], "curies": [{"href": "https://api.w.org/{rel}", "name": "wp", "templated": true}], "replies": [{"href": "https://owid.cloud/wp-json/wp/v2/comments?post=57804", "embeddable": true}], "wp:term": [{"href": "https://owid.cloud/wp-json/wp/v2/categories?post=57804", "taxonomy": "category", "embeddable": true}, {"href": "https://owid.cloud/wp-json/wp/v2/tags?post=57804", "taxonomy": "post_tag", "embeddable": true}], "collection": [{"href": "https://owid.cloud/wp-json/wp/v2/posts"}], "wp:attachment": [{"href": "https://owid.cloud/wp-json/wp/v2/media?parent=57804"}], "version-history": [{"href": "https://owid.cloud/wp-json/wp/v2/posts/57804/revisions", "count": 2}], "wp:featuredmedia": [{"href": "https://owid.cloud/wp-json/wp/v2/media/57346", "embeddable": true}], "predecessor-version": [{"id": 57806, "href": "https://owid.cloud/wp-json/wp/v2/posts/57804/revisions/57806"}]}, "author": 49, "format": "standard", "status": "publish", "sticky": false, "content": {"rendered": "", "protected": false}, "excerpt": {"rendered": "Tourism has massively increased in recent decades. Explore data and visualizations on the history and current state of tourism across the world on this page.", "protected": false}, "date_gmt": "2023-01-09T15:30:00", "modified": "2023-07-10T16:05:27", "template": "", "categories": [1], "ping_status": "closed", "authors_name": ["Bastian Herre", "Veronika Samborska", "Max Roser"], "modified_gmt… | |||
| 1234 | 1234 | 57799 | We just published a redesign of our work on Agricultural Production | agricultural-production-redesign | post | publish | {"id": "wp-57799", "slug": "agricultural-production-redesign", "content": {"toc": [], "body": [], "type": "article", "title": "We just published a redesign of our work on Agricultural Production", "authors": ["Hannah Ritchie", "Pablo Rosado", "Max Roser"], "excerpt": "Agricultural production is not only fundamental to improving nutrition, but is also the main source of income for many. Explore data and visualizations relating to the topic on this page.", "dateline": "January 4, 2023", "subtitle": "Agricultural production is not only fundamental to improving nutrition, but is also the main source of income for many. Explore data and visualizations relating to the topic on this page.", "sidebar-toc": false, "featured-image": "Agricultural-Production.png"}, "createdAt": "2023-07-10T15:24:18.000Z", "published": false, "updatedAt": "2023-07-10T15:03:45.000Z", "revisionId": null, "publishedAt": "2023-01-04T15:18:00.000Z", "relatedCharts": [], "publicationContext": "listed"} | {"errors": [], "numBlocks": 0, "numErrors": 0, "wpTagCounts": {}, "htmlTagCounts": {}} | 2023-01-04 15:18:00 | 2024-02-16 14:22:54 | ["Hannah Ritchie", "Pablo Rosado", "Max Roser"] | Agricultural production is not only fundamental to improving nutrition, but is also the main source of income for many. Explore data and visualizations relating to the topic on this page. | 2023-07-10 15:24:18 | 2023-07-10 15:03:45 | https://ourworldindata.org/wp-content/uploads/2023/01/Agricultural-Production.png | {} | {"id": 57799, "date": "2023-01-04T15:18:00", "guid": {"rendered": "https://owid.cloud/?p=57799"}, "link": "https://owid.cloud/agricultural-production-redesign", "meta": {"owid_publication_context_meta_field": {"latest": true, "homepage": true, "immediate_newsletter": true}}, "slug": "agricultural-production-redesign", "tags": [], "type": "post", "title": {"rendered": "We just published a redesign of our work on Agricultural Production"}, "_links": {"self": [{"href": "https://owid.cloud/wp-json/wp/v2/posts/57799"}], "about": [{"href": "https://owid.cloud/wp-json/wp/v2/types/post"}], "author": [{"href": "https://owid.cloud/wp-json/wp/v2/users/17", "embeddable": true}], "curies": [{"href": "https://api.w.org/{rel}", "name": "wp", "templated": true}], "replies": [{"href": "https://owid.cloud/wp-json/wp/v2/comments?post=57799", "embeddable": true}], "wp:term": [{"href": "https://owid.cloud/wp-json/wp/v2/categories?post=57799", "taxonomy": "category", "embeddable": true}, {"href": "https://owid.cloud/wp-json/wp/v2/tags?post=57799", "taxonomy": "post_tag", "embeddable": true}], "collection": [{"href": "https://owid.cloud/wp-json/wp/v2/posts"}], "wp:attachment": [{"href": "https://owid.cloud/wp-json/wp/v2/media?parent=57799"}], "version-history": [{"href": "https://owid.cloud/wp-json/wp/v2/posts/57799/revisions", "count": 2}], "wp:featuredmedia": [{"href": "https://owid.cloud/wp-json/wp/v2/media/55310", "embeddable": true}], "predecessor-version": [{"id": 57803, "href": "https://owid.cloud/wp-json/wp/v2/posts/57799/revisions/57803"}]}, "author": 17, "format": "standard", "status": "publish", "sticky": false, "content": {"rendered": "", "protected": false}, "excerpt": {"rendered": "Agricultural production is not only fundamental to improving nutrition, but is also the main source of income for many. Explore data and visualizations relating to the topic on this page.", "protected": false}, "date_gmt": "2023-01-04T15:18:00", "modified": "2023-07-10T16:03:45", "template": "", "categories": [1], "ping_status": "closed", "auth… | |||
| 1233 | 1233 | 57794 | We just published a redesign of our work on Books | books-redesign | post | publish | {"id": "wp-57794", "slug": "books-redesign", "content": {"toc": [], "body": [], "type": "article", "title": "We just published a redesign of our work on Books", "authors": ["Max Roser", "Hannah Ritchie"], "excerpt": "Books and written communication have played a crucial role in the spread of ideas and the development of culture. Explore historical data on manuscript and book production.", "dateline": "January 4, 2023", "subtitle": "Books and written communication have played a crucial role in the spread of ideas and the development of culture. Explore historical data on manuscript and book production.", "sidebar-toc": false, "featured-image": "Screen-Shot-2016-11-17-at-14.53.02.png"}, "createdAt": "2023-07-10T14:57:33.000Z", "published": false, "updatedAt": "2023-07-10T14:28:46.000Z", "revisionId": null, "publishedAt": "2023-01-04T15:01:00.000Z", "relatedCharts": [], "publicationContext": "listed"} | {"errors": [], "numBlocks": 0, "numErrors": 0, "wpTagCounts": {}, "htmlTagCounts": {}} | 2023-01-04 15:01:00 | 2024-02-16 14:22:54 | ["Max Roser", "Hannah Ritchie"] | Books and written communication have played a crucial role in the spread of ideas and the development of culture. Explore historical data on manuscript and book production. | 2023-07-10 14:57:33 | 2023-07-10 14:28:46 | https://ourworldindata.org/wp-content/uploads/2013/03/Screen-Shot-2016-11-17-at-14.53.02.png | {} | {"id": 57794, "date": "2023-01-04T15:01:00", "guid": {"rendered": "https://owid.cloud/?p=57794"}, "link": "https://owid.cloud/books-redesign", "meta": {"owid_publication_context_meta_field": {"latest": true, "homepage": true, "immediate_newsletter": true}}, "slug": "books-redesign", "tags": [], "type": "post", "title": {"rendered": "We just published a redesign of our work on Books"}, "_links": {"self": [{"href": "https://owid.cloud/wp-json/wp/v2/posts/57794"}], "about": [{"href": "https://owid.cloud/wp-json/wp/v2/types/post"}], "author": [{"href": "https://owid.cloud/wp-json/wp/v2/users/2", "embeddable": true}], "curies": [{"href": "https://api.w.org/{rel}", "name": "wp", "templated": true}], "replies": [{"href": "https://owid.cloud/wp-json/wp/v2/comments?post=57794", "embeddable": true}], "wp:term": [{"href": "https://owid.cloud/wp-json/wp/v2/categories?post=57794", "taxonomy": "category", "embeddable": true}, {"href": "https://owid.cloud/wp-json/wp/v2/tags?post=57794", "taxonomy": "post_tag", "embeddable": true}], "collection": [{"href": "https://owid.cloud/wp-json/wp/v2/posts"}], "wp:attachment": [{"href": "https://owid.cloud/wp-json/wp/v2/media?parent=57794"}], "version-history": [{"href": "https://owid.cloud/wp-json/wp/v2/posts/57794/revisions", "count": 4}], "wp:featuredmedia": [{"href": "https://owid.cloud/wp-json/wp/v2/media/9461", "embeddable": true}], "predecessor-version": [{"id": 57807, "href": "https://owid.cloud/wp-json/wp/v2/posts/57794/revisions/57807"}]}, "author": 2, "format": "standard", "status": "publish", "sticky": false, "content": {"rendered": "", "protected": false}, "excerpt": {"rendered": "Books and written communication have played a crucial role in the spread of ideas and the development of culture. Explore historical data on manuscript and book production.", "protected": false}, "date_gmt": "2023-01-04T15:01:00", "modified": "2023-07-10T15:28:46", "template": "", "categories": [1], "ping_status": "closed", "authors_name": ["Max Roser", "Hannah Ritchie"], "modified_gmt": "2023-07-10T… | |||
| 1232 | 1232 | 57781 | We published a new topic page on economic inequality | economic-inequality-redesign | post | publish | {"id": "wp-57781", "slug": "economic-inequality-redesign", "content": {"toc": [], "body": [], "type": "article", "title": "We published a new topic page on economic inequality", "authors": ["Joe Hasell", "Pablo Arriagada"], "excerpt": "Explore global data on economic inequality, and how this is changing over time.", "dateline": "July 7, 2023", "subtitle": "Explore global data on economic inequality, and how this is changing over time.", "sidebar-toc": false, "featured-image": "economic-inequality-featured-image-1.png"}, "createdAt": "2023-07-07T12:47:29.000Z", "published": false, "updatedAt": "2023-10-24T09:45:03.000Z", "revisionId": null, "publishedAt": "2023-07-07T11:47:29.000Z", "relatedCharts": [], "publicationContext": "listed"} | {"errors": [], "numBlocks": 0, "numErrors": 0, "wpTagCounts": {}, "htmlTagCounts": {}} | 2023-07-07 11:47:29 | 2024-02-16 14:22:55 | ["Joe Hasell", "Pablo Arriagada"] | Explore global data on economic inequality, and how this is changing over time. | 2023-07-07 12:47:29 | 2023-10-24 09:45:03 | https://ourworldindata.org/wp-content/uploads/2023/07/economic-inequality-featured-image-1.png | {} | {"id": 57781, "date": "2023-07-07T12:47:29", "guid": {"rendered": "https://owid.cloud/?p=57781"}, "link": "https://owid.cloud/economic-inequality-redesign", "meta": {"owid_publication_context_meta_field": {"latest": true, "homepage": true, "immediate_newsletter": true}}, "slug": "economic-inequality-redesign", "tags": [], "type": "post", "title": {"rendered": "We published a new topic page on economic inequality"}, "_links": {"self": [{"href": "https://owid.cloud/wp-json/wp/v2/posts/57781"}], "about": [{"href": "https://owid.cloud/wp-json/wp/v2/types/post"}], "author": [{"href": "https://owid.cloud/wp-json/wp/v2/users/14", "embeddable": true}], "curies": [{"href": "https://api.w.org/{rel}", "name": "wp", "templated": true}], "replies": [{"href": "https://owid.cloud/wp-json/wp/v2/comments?post=57781", "embeddable": true}], "wp:term": [{"href": "https://owid.cloud/wp-json/wp/v2/categories?post=57781", "taxonomy": "category", "embeddable": true}, {"href": "https://owid.cloud/wp-json/wp/v2/tags?post=57781", "taxonomy": "post_tag", "embeddable": true}], "collection": [{"href": "https://owid.cloud/wp-json/wp/v2/posts"}], "wp:attachment": [{"href": "https://owid.cloud/wp-json/wp/v2/media?parent=57781"}], "version-history": [{"href": "https://owid.cloud/wp-json/wp/v2/posts/57781/revisions", "count": 4}], "wp:featuredmedia": [{"href": "https://owid.cloud/wp-json/wp/v2/media/57778", "embeddable": true}], "predecessor-version": [{"id": 58390, "href": "https://owid.cloud/wp-json/wp/v2/posts/57781/revisions/58390"}]}, "author": 14, "format": "standard", "status": "publish", "sticky": false, "content": {"rendered": "", "protected": false}, "excerpt": {"rendered": "Explore global data on economic inequality, and how this is changing over time.", "protected": false}, "date_gmt": "2023-07-07T11:47:29", "modified": "2023-10-24T10:45:03", "template": "", "categories": [1], "ping_status": "closed", "authors_name": ["Joe Hasell", "Pablo Arriagada"], "modified_gmt": "2023-10-24T09:45:03", "comment_status": "closed", "featured_media": … | |||
| 1231 | 1231 | 57770 | Economic Inequality | economic-inequality | page | publish | <!-- wp:paragraph --> <p>THIS PAGE ONLY EXISTS TO GET ECONOMIC INEQUALITY LISTED IN THE BY-TOPIC MENU.</p> <!-- /wp:paragraph --> <!-- wp:paragraph --> <p>The inequality page is now in Google Docs: https://docs.google.com/document/d/1yzOrFd6uWvrAl2oFB3S67oOSbhgL1ffPHxjAqS7i-4w/edit</p> <!-- /wp:paragraph --> |
{"id": "wp-57770", "slug": "economic-inequality", "content": {"toc": [], "body": [{"type": "text", "value": [{"text": "THIS PAGE ONLY EXISTS TO GET ECONOMIC INEQUALITY LISTED IN THE BY-TOPIC MENU.", "spanType": "span-simple-text"}], "parseErrors": []}, {"type": "text", "value": [{"text": "The inequality page is now in Google Docs: https://docs.google.com/document/d/1yzOrFd6uWvrAl2oFB3S67oOSbhgL1ffPHxjAqS7i-4w/edit", "spanType": "span-simple-text"}], "parseErrors": []}], "type": "article", "title": "Economic Inequality", "authors": ["Joe Hasell", "Max Roser"], "dateline": "July 7, 2023", "sidebar-toc": false, "featured-image": "economic-inequality-featured-image-1.png"}, "createdAt": "2023-07-07T08:48:36.000Z", "published": false, "updatedAt": "2023-07-10T12:32:22.000Z", "revisionId": null, "publishedAt": "2023-07-07T08:00:13.000Z", "relatedCharts": [], "publicationContext": "listed"} | {"errors": [], "numBlocks": 2, "numErrors": 0, "wpTagCounts": {"paragraph": 2}, "htmlTagCounts": {"p": 2}} | 2023-07-07 08:00:13 | 2024-02-16 14:22:42 | ["Joe Hasell"] | 2023-07-07 08:48:36 | 2023-07-10 12:32:22 | https://ourworldindata.org/wp-content/uploads/2023/07/economic-inequality-featured-image-1.png | {} | THIS PAGE ONLY EXISTS TO GET ECONOMIC INEQUALITY LISTED IN THE BY-TOPIC MENU. The inequality page is now in Google Docs: https://docs.google.com/document/d/1yzOrFd6uWvrAl2oFB3S67oOSbhgL1ffPHxjAqS7i-4w/edit | {"id": 57770, "date": "2023-07-07T09:00:13", "guid": {"rendered": "https://owid.cloud/?page_id=57770"}, "link": "https://owid.cloud/economic-inequality", "meta": {"owid_publication_context_meta_field": [], "owid_key_performance_indicators_meta_field": {"raw": "Many countries have high levels of economic inequality. Inequality across the world as a whole has fallen but remains vast.", "rendered": "<p>Many countries have high levels of economic inequality. Inequality across the world as a whole has fallen but remains vast.</p>\n"}}, "slug": "economic-inequality", "tags": [], "type": "page", "title": {"rendered": "Economic Inequality"}, "_links": {"self": [{"href": "https://owid.cloud/wp-json/wp/v2/pages/57770"}], "about": [{"href": "https://owid.cloud/wp-json/wp/v2/types/page"}], "author": [{"href": "https://owid.cloud/wp-json/wp/v2/users/14", "embeddable": true}], "curies": [{"href": "https://api.w.org/{rel}", "name": "wp", "templated": true}], "replies": [{"href": "https://owid.cloud/wp-json/wp/v2/comments?post=57770", "embeddable": true}], "wp:term": [{"href": "https://owid.cloud/wp-json/wp/v2/categories?post=57770", "taxonomy": "category", "embeddable": true}, {"href": "https://owid.cloud/wp-json/wp/v2/tags?post=57770", "taxonomy": "post_tag", "embeddable": true}], "collection": [{"href": "https://owid.cloud/wp-json/wp/v2/pages"}], "wp:attachment": [{"href": "https://owid.cloud/wp-json/wp/v2/media?parent=57770"}], "version-history": [{"href": "https://owid.cloud/wp-json/wp/v2/pages/57770/revisions", "count": 2}], "wp:featuredmedia": [{"href": "https://owid.cloud/wp-json/wp/v2/media/57778", "embeddable": true}], "predecessor-version": [{"id": 57792, "href": "https://owid.cloud/wp-json/wp/v2/pages/57770/revisions/57792"}]}, "author": 14, "parent": 0, "status": "publish", "content": {"rendered": "\n<p>THIS PAGE ONLY EXISTS TO GET ECONOMIC INEQUALITY LISTED IN THE BY-TOPIC MENU.</p>\n\n\n\n<p>The inequality page is now in Google Docs: https://docs.google.com/document/d/1yzOrFd6uWvrAl2oFB3S67oOSbhgL1ffPHxjAqS7i-4w/e… | ||
| 1230 | 1230 | 57760 | About this data (main inequality explorer) | about-this-data-main-inequality-explorer | wp_block | publish | <!-- wp:heading {"level":3} -->
<h3>About this data</h3>
<!-- /wp:heading -->
<!-- wp:paragraph -->
<p>This data explorer provides a range of inequality indicators measured according to two different definitions of income obtained from different sources.</p>
<!-- /wp:paragraph -->
<!-- wp:list -->
<ul><li>Data from the World Inequality Database relates to inequality before taxes and benefits.</li><li>Data from the World Bank relates to either income after taxes and benefits or consumption, depending on the country and year.</li></ul>
<!-- /wp:list -->
<!-- wp:paragraph -->
<p>Further information about the definitions and methods behind this data can be found in the article below, where you can also explore and compare a much broader range of indicators from different sources:</p>
<!-- /wp:paragraph -->
<!-- wp:paragraph -->
<p><a href="https://ourworldindata.org/owid-data-collection-inequality-and-poverty">OWID Data Collection: Inequality and Poverty</a></p>
<!-- /wp:paragraph --> |
{"id": "wp-57760", "slug": "about-this-data-main-inequality-explorer", "content": {"toc": [], "body": [{"text": [{"text": "About this data", "spanType": "span-simple-text"}], "type": "heading", "level": 2, "parseErrors": []}, {"type": "text", "value": [{"text": "This data explorer provides a range of inequality indicators measured according to two different definitions of income obtained from different sources.", "spanType": "span-simple-text"}], "parseErrors": []}, {"type": "list", "items": [{"type": "text", "value": [{"text": "Data from the World Inequality Database relates to inequality before taxes and benefits.", "spanType": "span-simple-text"}], "parseErrors": []}, {"type": "text", "value": [{"text": "Data from the World Bank relates to either income after taxes and benefits or consumption, depending on the country and year.", "spanType": "span-simple-text"}], "parseErrors": []}], "parseErrors": []}, {"type": "text", "value": [{"text": "Further information about the definitions and methods behind this data can be found in the article below, where you can also explore and compare a much broader range of indicators from different sources:", "spanType": "span-simple-text"}], "parseErrors": []}, {"type": "text", "value": [{"url": "https://ourworldindata.org/owid-data-collection-inequality-and-poverty", "children": [{"text": "OWID Data Collection: Inequality and Poverty", "spanType": "span-simple-text"}], "spanType": "span-link"}], "parseErrors": []}], "type": "article", "title": "About this data (main inequality explorer)", "authors": [null], "dateline": "July 6, 2023", "sidebar-toc": false, "featured-image": ""}, "createdAt": "2023-07-06T18:18:16.000Z", "published": false, "updatedAt": "2023-07-06T17:30:15.000Z", "revisionId": null, "publishedAt": "2023-07-06T17:18:16.000Z", "relatedCharts": [], "publicationContext": "listed"} | {"errors": [{"name": "unexpected wp component tag", "details": "Found unhandled wp:comment tag list"}], "numBlocks": 5, "numErrors": 1, "wpTagCounts": {"list": 1, "heading": 1, "paragraph": 3}, "htmlTagCounts": {"p": 3, "h3": 1, "ul": 1}} | 2023-07-06 17:18:16 | 2025-02-14 10:07:32 | [null] | 2023-07-06 18:18:16 | 2023-07-06 17:30:15 | {} | ## About this data This data explorer provides a range of inequality indicators measured according to two different definitions of income obtained from different sources. * Data from the World Inequality Database relates to inequality before taxes and benefits. * Data from the World Bank relates to either income after taxes and benefits or consumption, depending on the country and year. Further information about the definitions and methods behind this data can be found in the article below, where you can also explore and compare a much broader range of indicators from different sources: [OWID Data Collection: Inequality and Poverty](https://ourworldindata.org/owid-data-collection-inequality-and-poverty) | {"data": {"wpBlock": {"content": "\n<h3>About this data</h3>\n\n\n\n<p>This data explorer provides a range of inequality indicators measured according to two different definitions of income obtained from different sources.</p>\n\n\n\n<ul><li>Data from the World Inequality Database relates to income before taxes and benefits.</li><li>Data from the World Bank relates to either income after taxes and benefits or consumption, depending on the country and year.</li></ul>\n\n\n\n<p>Further information about the definitions and methods behind this data can be found in the article below, where you can also explore and compare a much broader range of indicators from different sources:</p>\n\n\n\n<p><a href=\"https://ourworldindata.org/owid-data-collection-inequality-and-poverty\">OWID Data Collection: Inequality and Poverty</a></p>\n"}}, "extensions": {"debug": [{"type": "DEBUG_LOGS_INACTIVE", "message": "GraphQL Debug logging is not active. To see debug logs, GRAPHQL_DEBUG must be enabled."}]}} | |||
| 1229 | 1229 | 57756 | About this data (PIP explorers) | about-this-data-pip-explorers | wp_block | publish | <!-- wp:heading {"level":3} -->
<h3>About this data</h3>
<!-- /wp:heading -->
<!-- wp:paragraph -->
<p>This data explorer provides a range of indicators obtained from the World Bank Poverty and Inequality Platform. Depending on the country and year, the data relates to income measured after taxes and benefits, or consumption, per capita.</p>
<!-- /wp:paragraph -->
<!-- wp:paragraph -->
<p>Further information about the definitions and methods behind this data can be found in the article below, where you can also explore and compare a much broader range of indicators:</p>
<!-- /wp:paragraph -->
<!-- wp:paragraph -->
<p><a href="https://ourworldindata.org/owid-data-collection-inequality-and-poverty">OWID Data Collection: Inequality and Poverty</a></p>
<!-- /wp:paragraph --> |
{"id": "wp-57756", "slug": "about-this-data-pip-explorers", "content": {"toc": [], "body": [{"text": [{"text": "About this data", "spanType": "span-simple-text"}], "type": "heading", "level": 2, "parseErrors": []}, {"type": "text", "value": [{"text": "This data explorer provides a range of indicators obtained from the World Bank Poverty and Inequality Platform. Depending on the country and year, the data relates to income measured after taxes and benefits, or consumption, per capita.", "spanType": "span-simple-text"}], "parseErrors": []}, {"type": "text", "value": [{"text": "Further information about the definitions and methods behind this data can be found in the article below, where you can also explore and compare a much broader range of indicators:", "spanType": "span-simple-text"}], "parseErrors": []}, {"type": "text", "value": [{"url": "https://ourworldindata.org/owid-data-collection-inequality-and-poverty", "children": [{"text": "OWID Data Collection: Inequality and Poverty", "spanType": "span-simple-text"}], "spanType": "span-link"}], "parseErrors": []}], "type": "article", "title": "About this data (PIP explorers)", "authors": [null], "dateline": "July 6, 2023", "sidebar-toc": false, "featured-image": ""}, "createdAt": "2023-07-06T18:14:45.000Z", "published": false, "updatedAt": "2024-02-02T17:32:21.000Z", "revisionId": null, "publishedAt": "2023-07-06T17:14:45.000Z", "relatedCharts": [], "publicationContext": "listed"} | {"errors": [], "numBlocks": 4, "numErrors": 0, "wpTagCounts": {"heading": 1, "paragraph": 3}, "htmlTagCounts": {"p": 3, "h3": 1}} | 2023-07-06 17:14:45 | 2024-02-16 14:23:03 | [null] | 2023-07-06 18:14:45 | 2024-02-02 17:32:21 | {} | ## About this data This data explorer provides a range of indicators obtained from the World Bank Poverty and Inequality Platform. Depending on the country and year, the data relates to income measured after taxes and benefits, or consumption, per capita. Further information about the definitions and methods behind this data can be found in the article below, where you can also explore and compare a much broader range of indicators: [OWID Data Collection: Inequality and Poverty](https://ourworldindata.org/owid-data-collection-inequality-and-poverty) | {"data": {"wpBlock": {"content": "\n<h3>About this data</h3>\n\n\n\n<p>This data explorer provides a range of indicators obtained from the World Bank Poverty and Inequality Platform. Depending on the country and year, the data relates to income measured after taxes and benefits, or consumption, per capita.</p>\n\n\n\n<p>Further information about the definitions and methods behind this data can be found in the article below, where you can also explore and compare a much broader range of indicators:</p>\n\n\n\n<p><a href=\"https://ourworldindata.org/owid-data-collection-inequality-and-poverty\">OWID Data Collection: Inequality and Poverty</a></p>\n"}}, "extensions": {"debug": [{"type": "DEBUG_LOGS_INACTIVE", "message": "GraphQL Debug logging is not active. To see debug logs, GRAPHQL_DEBUG must be enabled."}]}} | |||
| 1228 | 1228 | 57755 | About this data (LIS explorers) | about-this-data-lis-explorers | wp_block | publish | <!-- wp:heading {"level":3} -->
<h3>About this data</h3>
<!-- /wp:heading -->
<!-- wp:paragraph -->
<p>This data explorer provides a range of indicators obtained from the Luxemburg Income Study dataset, related to income before and after taxes and benefits.</p>
<!-- /wp:paragraph -->
<!-- wp:paragraph -->
<p>Further information about the definitions and methods behind this data can be found in the article below, where you can also explore and compare a much broader range of indicators:</p>
<!-- /wp:paragraph -->
<!-- wp:paragraph -->
<p><a href="https://ourworldindata.org/owid-data-collection-inequality-and-poverty">OWID Data Collection: Inequality and Poverty</a></p>
<!-- /wp:paragraph --> |
{"id": "wp-57755", "slug": "about-this-data-lis-explorers", "content": {"toc": [], "body": [{"text": [{"text": "About this data", "spanType": "span-simple-text"}], "type": "heading", "level": 2, "parseErrors": []}, {"type": "text", "value": [{"text": "This data explorer provides a range of indicators obtained from the Luxemburg Income Study dataset, related to income before and after taxes and benefits.", "spanType": "span-simple-text"}], "parseErrors": []}, {"type": "text", "value": [{"text": "Further information about the definitions and methods behind this data can be found in the article below, where you can also explore and compare a much broader range of indicators:", "spanType": "span-simple-text"}], "parseErrors": []}, {"type": "text", "value": [{"url": "https://ourworldindata.org/owid-data-collection-inequality-and-poverty", "children": [{"text": "OWID Data Collection: Inequality and Poverty", "spanType": "span-simple-text"}], "spanType": "span-link"}], "parseErrors": []}], "type": "article", "title": "About this data (LIS explorers)", "authors": [null], "dateline": "July 6, 2023", "sidebar-toc": false, "featured-image": ""}, "createdAt": "2023-07-06T18:13:07.000Z", "published": false, "updatedAt": "2024-02-02T17:32:28.000Z", "revisionId": null, "publishedAt": "2023-07-06T17:13:07.000Z", "relatedCharts": [], "publicationContext": "listed"} | {"errors": [], "numBlocks": 4, "numErrors": 0, "wpTagCounts": {"heading": 1, "paragraph": 3}, "htmlTagCounts": {"p": 3, "h3": 1}} | 2023-07-06 17:13:07 | 2024-02-16 14:23:03 | [null] | 2023-07-06 18:13:07 | 2024-02-02 17:32:28 | {} | ## About this data This data explorer provides a range of indicators obtained from the Luxemburg Income Study dataset, related to income before and after taxes and benefits. Further information about the definitions and methods behind this data can be found in the article below, where you can also explore and compare a much broader range of indicators: [OWID Data Collection: Inequality and Poverty](https://ourworldindata.org/owid-data-collection-inequality-and-poverty) | {"data": {"wpBlock": {"content": "\n<h3>About this data</h3>\n\n\n\n<p>This data explorer provides a range of indicators obtained from the Luxemburg Income Study dataset, related to income before and after taxes and benefits.</p>\n\n\n\n<p>Further information about the definitions and methods behind this data can be found in the article below, where you can also explore and compare a much broader range of indicators:</p>\n\n\n\n<p><a href=\"https://ourworldindata.org/owid-data-collection-inequality-and-poverty\">OWID Data Collection: Inequality and Poverty</a></p>\n"}}, "extensions": {"debug": [{"type": "DEBUG_LOGS_INACTIVE", "message": "GraphQL Debug logging is not active. To see debug logs, GRAPHQL_DEBUG must be enabled."}]}} | |||
| 1227 | 1227 | 57750 | About this data (WID explorers) | about-this-data-wid-explorers | wp_block | publish | <!-- wp:heading {"level":3} -->
<h3>About this data</h3>
<!-- /wp:heading -->
<!-- wp:paragraph -->
<p>This data explorer provides a range of indicators obtained from the World Inequality Database, related to income before and after taxes and benefits.</p>
<!-- /wp:paragraph -->
<!-- wp:paragraph -->
<p>Further information about the definitions and methods behind this data can be found in the article below, where you can also explore and compare a much broader range of indicators:</p>
<!-- /wp:paragraph -->
<!-- wp:paragraph -->
<p><a href="https://ourworldindata.org/owid-data-collection-inequality-and-poverty">OWID Data Collection: Inequality and Poverty</a></p>
<!-- /wp:paragraph --> |
{"id": "wp-57750", "slug": "about-this-data-wid-explorers", "content": {"toc": [], "body": [{"text": [{"text": "About this data", "spanType": "span-simple-text"}], "type": "heading", "level": 2, "parseErrors": []}, {"type": "text", "value": [{"text": "This data explorer provides a range of indicators obtained from the World Inequality Database, related to income before and after taxes and benefits.", "spanType": "span-simple-text"}], "parseErrors": []}, {"type": "text", "value": [{"text": "Further information about the definitions and methods behind this data can be found in the article below, where you can also explore and compare a much broader range of indicators:", "spanType": "span-simple-text"}], "parseErrors": []}, {"type": "text", "value": [{"url": "https://ourworldindata.org/owid-data-collection-inequality-and-poverty", "children": [{"text": "OWID Data Collection: Inequality and Poverty", "spanType": "span-simple-text"}], "spanType": "span-link"}], "parseErrors": []}], "type": "article", "title": "About this data (WID explorers)", "authors": [null], "dateline": "July 6, 2023", "sidebar-toc": false, "featured-image": ""}, "createdAt": "2023-07-06T18:09:52.000Z", "published": false, "updatedAt": "2023-07-06T17:29:14.000Z", "revisionId": null, "publishedAt": "2023-07-06T17:09:52.000Z", "relatedCharts": [], "publicationContext": "listed"} | {"errors": [], "numBlocks": 4, "numErrors": 0, "wpTagCounts": {"heading": 1, "paragraph": 3}, "htmlTagCounts": {"p": 3, "h3": 1}} | 2023-07-06 17:09:52 | 2024-02-16 14:23:03 | [null] | 2023-07-06 18:09:52 | 2023-07-06 17:29:14 | {} | ## About this data This data explorer provides a range of indicators obtained from the World Inequality Database, related to income before and after taxes and benefits. Further information about the definitions and methods behind this data can be found in the article below, where you can also explore and compare a much broader range of indicators: [OWID Data Collection: Inequality and Poverty](https://ourworldindata.org/owid-data-collection-inequality-and-poverty) | {"data": {"wpBlock": {"content": "\n<h3>About this data</h3>\n\n\n\n<p>This data explorer provides a range of indicators obtained from the World Inequality Database, related to income before and after taxes and benefits.</p>\n\n\n\n<p>Further information about the definitions and methods behind this data can be found in the article below, where you can also explore and compare a much broader range of indicators:</p>\n\n\n\n<p><a href=\"https://ourworldindata.org/owid-data-collection-inequality-and-poverty\">OWID Data Collection: Inequality and Poverty</a></p>\n"}}, "extensions": {"debug": [{"type": "DEBUG_LOGS_INACTIVE", "message": "GraphQL Debug logging is not active. To see debug logs, GRAPHQL_DEBUG must be enabled."}]}} | |||
| 1226 | 1226 | 57742 | About this data (Inequality and Incomes Across the Distribution comparison explorers) | 57742 | wp_block | publish | <!-- wp:heading {"level":3} -->
<h3>About this data</h3>
<!-- /wp:heading -->
<!-- wp:paragraph -->
<p>This data explorer provides a range of indicators obtained from different sources.</p>
<!-- /wp:paragraph -->
<!-- wp:list -->
<ul><li>Data from the World Bank relates to either income per capita after taxes and benefits or consumption, depending on the country and year.</li><li>Data from the World Inequality Database and Luxembourg Income Study relate to income before and after taxes and benefits.</li></ul>
<!-- /wp:list -->
<!-- wp:paragraph -->
<p>Further information about the definitions and methods behind this data can be found in the article below, where you can also explore and compare a much broader range of indicators:</p>
<!-- /wp:paragraph -->
<!-- wp:paragraph -->
<p><a href="https://ourworldindata.org/owid-data-collection-inequality-and-poverty">OWID Data Collection: Inequality and Poverty</a></p>
<!-- /wp:paragraph --> |
{"id": "wp-57742", "slug": "57742", "content": {"toc": [], "body": [{"text": [{"text": "About this data", "spanType": "span-simple-text"}], "type": "heading", "level": 2, "parseErrors": []}, {"type": "text", "value": [{"text": "This data explorer provides a range of indicators obtained from different sources.", "spanType": "span-simple-text"}], "parseErrors": []}, {"type": "list", "items": [{"type": "text", "value": [{"text": "Data from the World Bank relates to either income per capita after taxes and benefits or consumption, depending on the country and year.", "spanType": "span-simple-text"}], "parseErrors": []}, {"type": "text", "value": [{"text": "Data from the World Inequality Database and Luxembourg Income Study relate to income before and after taxes and benefits.", "spanType": "span-simple-text"}], "parseErrors": []}], "parseErrors": []}, {"type": "text", "value": [{"text": "Further information about the definitions and methods behind this data can be found in the article below, where you can also explore and compare a much broader range of indicators:", "spanType": "span-simple-text"}], "parseErrors": []}, {"type": "text", "value": [{"url": "https://ourworldindata.org/owid-data-collection-inequality-and-poverty", "children": [{"text": "OWID Data Collection: Inequality and Poverty", "spanType": "span-simple-text"}], "spanType": "span-link"}], "parseErrors": []}], "type": "article", "title": "About this data (Inequality and Incomes Across the Distribution comparison explorers)", "authors": [null], "dateline": "July 6, 2023", "sidebar-toc": false, "featured-image": ""}, "createdAt": "2023-07-06T17:59:59.000Z", "published": false, "updatedAt": "2023-07-06T17:29:02.000Z", "revisionId": null, "publishedAt": "2023-07-06T17:00:46.000Z", "relatedCharts": [], "publicationContext": "listed"} | {"errors": [{"name": "unexpected wp component tag", "details": "Found unhandled wp:comment tag list"}], "numBlocks": 5, "numErrors": 1, "wpTagCounts": {"list": 1, "heading": 1, "paragraph": 3}, "htmlTagCounts": {"p": 3, "h3": 1, "ul": 1}} | 2023-07-06 17:00:46 | 2024-02-16 14:23:03 | [null] | 2023-07-06 17:59:59 | 2023-07-06 17:29:02 | {} | ## About this data This data explorer provides a range of indicators obtained from different sources. * Data from the World Bank relates to either income per capita after taxes and benefits or consumption, depending on the country and year. * Data from the World Inequality Database and Luxembourg Income Study relate to income before and after taxes and benefits. Further information about the definitions and methods behind this data can be found in the article below, where you can also explore and compare a much broader range of indicators: [OWID Data Collection: Inequality and Poverty](https://ourworldindata.org/owid-data-collection-inequality-and-poverty) | {"data": {"wpBlock": {"content": "\n<h3>About this data</h3>\n\n\n\n<p>This data explorer provides a range of indicators obtained from different sources.</p>\n\n\n\n<ul><li>Data from the World Bank relates to either income per capita after taxes and benefits or consumption, depending on the country and year.</li><li>Data from the World Inequality Database and Luxembourg Income Study relate to income before and after taxes and benefits.</li></ul>\n\n\n\n<p>Further information about the definitions and methods behind this data can be found in the article below, where you can also explore and compare a much broader range of indicators:</p>\n\n\n\n<p><a href=\"https://ourworldindata.org/owid-data-collection-inequality-and-poverty\">OWID Data Collection: Inequality and Poverty</a></p>\n"}}, "extensions": {"debug": [{"type": "DEBUG_LOGS_INACTIVE", "message": "GraphQL Debug logging is not active. To see debug logs, GRAPHQL_DEBUG must be enabled."}]}} | |||
| 1225 | 1225 | 57728 | About this data (Poverty comparison explorer) | about-this-data | wp_block | publish | <!-- wp:heading {"level":3} -->
<h3>About this data</h3>
<!-- /wp:heading -->
<!-- wp:paragraph -->
<p>This data explorer provides a range of poverty indicators obtained from different sources.</p>
<!-- /wp:paragraph -->
<!-- wp:list -->
<ul><li>Data from the World Bank relates to either income per capita after taxes and benefits or consumption per capita, depending on the country and year.</li><li>Data from the Luxembourg Income Study relates to income after taxes and benefits per capita.</li></ul>
<!-- /wp:list -->
<!-- wp:paragraph -->
<p>Further information about the definitions and methods behind this data can be found in the article below, where you can also explore and compare a much broader range of indicators:</p>
<!-- /wp:paragraph -->
<!-- wp:paragraph -->
<p><a href="https://ourworldindata.org/owid-data-collection-inequality-and-poverty">OWID Data Collection: Inequality and Poverty</a></p>
<!-- /wp:paragraph -->
<!-- wp:paragraph -->
<p></p>
<!-- /wp:paragraph -->
<!-- wp:paragraph -->
<p></p>
<!-- /wp:paragraph --> |
{"id": "wp-57728", "slug": "about-this-data", "content": {"toc": [], "body": [{"text": [{"text": "About this data", "spanType": "span-simple-text"}], "type": "heading", "level": 2, "parseErrors": []}, {"type": "text", "value": [{"text": "This data explorer provides a range of poverty indicators obtained from different sources.", "spanType": "span-simple-text"}], "parseErrors": []}, {"type": "list", "items": [{"type": "text", "value": [{"text": "Data from the World Bank relates to either income per capita after taxes and benefits or consumption per capita, depending on the country and year.", "spanType": "span-simple-text"}], "parseErrors": []}, {"type": "text", "value": [{"text": "Data from the Luxembourg Income Study relates to income after taxes and benefits per capita.", "spanType": "span-simple-text"}], "parseErrors": []}], "parseErrors": []}, {"type": "text", "value": [{"text": "Further information about the definitions and methods behind this data can be found in the article below, where you can also explore and compare a much broader range of indicators:", "spanType": "span-simple-text"}], "parseErrors": []}, {"type": "text", "value": [{"url": "https://ourworldindata.org/owid-data-collection-inequality-and-poverty", "children": [{"text": "OWID Data Collection: Inequality and Poverty", "spanType": "span-simple-text"}], "spanType": "span-link"}], "parseErrors": []}], "type": "article", "title": "About this data (Poverty comparison explorer)", "authors": [null], "dateline": "July 6, 2023", "sidebar-toc": false, "featured-image": ""}, "createdAt": "2023-07-06T17:36:01.000Z", "published": false, "updatedAt": "2023-07-06T17:29:07.000Z", "revisionId": null, "publishedAt": "2023-07-06T16:36:08.000Z", "relatedCharts": [], "publicationContext": "listed"} | {"errors": [{"name": "unexpected wp component tag", "details": "Found unhandled wp:comment tag list"}], "numBlocks": 5, "numErrors": 1, "wpTagCounts": {"list": 1, "heading": 1, "paragraph": 5}, "htmlTagCounts": {"p": 5, "h3": 1, "ul": 1}} | 2023-07-06 16:36:08 | 2024-02-16 14:23:03 | [null] | 2023-07-06 17:36:01 | 2023-07-06 17:29:07 | {} | ## About this data This data explorer provides a range of poverty indicators obtained from different sources. * Data from the World Bank relates to either income per capita after taxes and benefits or consumption per capita, depending on the country and year. * Data from the Luxembourg Income Study relates to income after taxes and benefits per capita. Further information about the definitions and methods behind this data can be found in the article below, where you can also explore and compare a much broader range of indicators: [OWID Data Collection: Inequality and Poverty](https://ourworldindata.org/owid-data-collection-inequality-and-poverty) | {"data": {"wpBlock": {"content": "\n<h3>About this data</h3>\n\n\n\n<p>This data explorer provides a range of poverty indicators obtained from different sources.</p>\n\n\n\n<ul><li>Data from the World Bank relates to either income per capita after taxes and benefits or consumption per capita, depending on the country and year.</li><li>Data from the Luxembourg Income Study relates to income after taxes and benefits per capita.</li></ul>\n\n\n\n<p>Further information about the definitions and methods behind this data can be found in the article below, where you can also explore and compare a much broader range of indicators:</p>\n\n\n\n<p><a href=\"https://ourworldindata.org/owid-data-collection-inequality-and-poverty\">OWID Data Collection: Inequality and Poverty</a></p>\n\n\n\n<p></p>\n\n\n\n<p></p>\n"}}, "extensions": {"debug": [{"type": "DEBUG_LOGS_INACTIVE", "message": "GraphQL Debug logging is not active. To see debug logs, GRAPHQL_DEBUG must be enabled."}]}} | |||
| 1224 | 1224 | 57720 | We published a new topic page on Human Rights | human-rights-redesign | post | publish | {"id": "wp-57720", "slug": "human-rights-redesign", "content": {"toc": [], "body": [], "type": "article", "title": "We published a new topic page on Human Rights", "authors": ["Bastian Herre", "Pablo Arriagada"], "excerpt": "Explore data on human rights across the world, and see how these rights have changed over time.", "dateline": "July 5, 2023", "subtitle": "Explore data on human rights across the world, and see how these rights have changed over time.", "sidebar-toc": false, "featured-image": "Human-Rights.png"}, "createdAt": "2023-07-05T12:15:21.000Z", "published": false, "updatedAt": "2023-07-27T12:14:36.000Z", "revisionId": null, "publishedAt": "2023-07-05T11:15:21.000Z", "relatedCharts": [], "publicationContext": "listed"} | {"errors": [], "numBlocks": 0, "numErrors": 0, "wpTagCounts": {}, "htmlTagCounts": {}} | 2023-07-05 11:15:21 | 2024-02-16 14:22:55 | ["Bastian Herre", "Pablo Arriagada"] | Explore data on human rights across the world, and see how these rights have changed over time. | 2023-07-05 12:15:21 | 2023-07-27 12:14:36 | https://ourworldindata.org/wp-content/uploads/2023/05/Human-Rights.png | {} | {"id": 57720, "date": "2023-07-05T12:15:21", "guid": {"rendered": "https://owid.cloud/?p=57720"}, "link": "https://owid.cloud/human-rights-redesign", "meta": {"owid_publication_context_meta_field": {"latest": true, "homepage": true, "immediate_newsletter": true}}, "slug": "human-rights-redesign", "tags": [], "type": "post", "title": {"rendered": "We published a new topic page on Human Rights"}, "_links": {"self": [{"href": "https://owid.cloud/wp-json/wp/v2/posts/57720"}], "about": [{"href": "https://owid.cloud/wp-json/wp/v2/types/post"}], "author": [{"href": "https://owid.cloud/wp-json/wp/v2/users/49", "embeddable": true}], "curies": [{"href": "https://api.w.org/{rel}", "name": "wp", "templated": true}], "replies": [{"href": "https://owid.cloud/wp-json/wp/v2/comments?post=57720", "embeddable": true}], "wp:term": [{"href": "https://owid.cloud/wp-json/wp/v2/categories?post=57720", "taxonomy": "category", "embeddable": true}, {"href": "https://owid.cloud/wp-json/wp/v2/tags?post=57720", "taxonomy": "post_tag", "embeddable": true}], "collection": [{"href": "https://owid.cloud/wp-json/wp/v2/posts"}], "wp:attachment": [{"href": "https://owid.cloud/wp-json/wp/v2/media?parent=57720"}], "version-history": [{"href": "https://owid.cloud/wp-json/wp/v2/posts/57720/revisions", "count": 3}], "wp:featuredmedia": [{"href": "https://owid.cloud/wp-json/wp/v2/media/57085", "embeddable": true}], "predecessor-version": [{"id": 57930, "href": "https://owid.cloud/wp-json/wp/v2/posts/57720/revisions/57930"}]}, "author": 49, "format": "standard", "status": "publish", "sticky": false, "content": {"rendered": "", "protected": false}, "excerpt": {"rendered": "Explore data on human rights across the world, and see how these rights have changed over time.", "protected": false}, "date_gmt": "2023-07-05T11:15:21", "modified": "2023-07-27T13:14:36", "template": "", "categories": [1], "ping_status": "closed", "authors_name": ["Bastian Herre", "Pablo Arriagada"], "modified_gmt": "2023-07-27T12:14:36", "comment_status": "closed", "featured_media": 57… | |||
| 1222 | 1222 | 57695 | We published a new topic page on Diarrheal Diseases | diarrheal-diseases-redesign | post | publish | {"id": "wp-57695", "slug": "diarrheal-diseases-redesign", "content": {"toc": [], "body": [], "type": "article", "title": "We published a new topic page on Diarrheal Diseases", "authors": ["Saloni Dattani", "Fiona Spooner"], "excerpt": "Diarrheal diseases are a leading cause of death, especially among children. Explore global data on deaths and treatment for this killer.", "dateline": "July 3, 2023", "subtitle": "Diarrheal diseases are a leading cause of death, especially among children. Explore global data on deaths and treatment for this killer.", "sidebar-toc": false, "featured-image": "diarrheal-diseases-thumbnail.png"}, "createdAt": "2023-07-03T11:35:18.000Z", "published": false, "updatedAt": "2023-07-27T12:14:56.000Z", "revisionId": null, "publishedAt": "2023-07-03T10:35:18.000Z", "relatedCharts": [], "publicationContext": "listed"} | {"errors": [], "numBlocks": 0, "numErrors": 0, "wpTagCounts": {}, "htmlTagCounts": {}} | 2023-07-03 10:35:18 | 2024-02-16 14:22:55 | ["Saloni Dattani", "Fiona Spooner"] | Diarrheal diseases are a leading cause of death, especially among children. Explore global data on deaths and treatment for this killer. | 2023-07-03 11:35:18 | 2023-07-27 12:14:56 | https://ourworldindata.org/wp-content/uploads/2023/06/diarrheal-diseases-thumbnail.png | {} | {"id": 57695, "date": "2023-07-03T11:35:18", "guid": {"rendered": "https://owid.cloud/?p=57695"}, "link": "https://owid.cloud/diarrheal-diseases-redesign", "meta": {"owid_publication_context_meta_field": {"latest": true, "homepage": true, "immediate_newsletter": true}}, "slug": "diarrheal-diseases-redesign", "tags": [], "type": "post", "title": {"rendered": "We published a new topic page on Diarrheal Diseases"}, "_links": {"self": [{"href": "https://owid.cloud/wp-json/wp/v2/posts/57695"}], "about": [{"href": "https://owid.cloud/wp-json/wp/v2/types/post"}], "author": [{"href": "https://owid.cloud/wp-json/wp/v2/users/47", "embeddable": true}], "curies": [{"href": "https://api.w.org/{rel}", "name": "wp", "templated": true}], "replies": [{"href": "https://owid.cloud/wp-json/wp/v2/comments?post=57695", "embeddable": true}], "wp:term": [{"href": "https://owid.cloud/wp-json/wp/v2/categories?post=57695", "taxonomy": "category", "embeddable": true}, {"href": "https://owid.cloud/wp-json/wp/v2/tags?post=57695", "taxonomy": "post_tag", "embeddable": true}], "collection": [{"href": "https://owid.cloud/wp-json/wp/v2/posts"}], "wp:attachment": [{"href": "https://owid.cloud/wp-json/wp/v2/media?parent=57695"}], "version-history": [{"href": "https://owid.cloud/wp-json/wp/v2/posts/57695/revisions", "count": 3}], "wp:featuredmedia": [{"href": "https://owid.cloud/wp-json/wp/v2/media/57378", "embeddable": true}], "predecessor-version": [{"id": 57931, "href": "https://owid.cloud/wp-json/wp/v2/posts/57695/revisions/57931"}]}, "author": 47, "format": "standard", "status": "publish", "sticky": false, "content": {"rendered": "", "protected": false}, "excerpt": {"rendered": "Diarrheal diseases are a leading cause of death, especially among children. Explore global data on deaths and treatment for this killer.", "protected": false}, "date_gmt": "2023-07-03T10:35:18", "modified": "2023-07-27T13:14:56", "template": "", "categories": [1], "ping_status": "closed", "authors_name": ["Saloni Dattani", "Fiona Spooner"], "modified_gmt": "2023-07-27T1… | |||
| 1220 | 1220 | 57643 | We published a new topic page on Women's Rights | womens-rights-launch | post | publish | {"id": "wp-57643", "slug": "womens-rights-launch", "content": {"toc": [], "body": [], "type": "article", "title": "We published a new topic page on Women's Rights", "authors": ["Bastian Herre", "Pablo Arriagada"], "excerpt": "How has the protection of women’s rights changed over time? How does it differ across countries? Explore global data on women’s rights.", "dateline": "June 29, 2023", "subtitle": "How has the protection of women’s rights changed over time? How does it differ across countries? Explore global data on women’s rights.", "sidebar-toc": false, "featured-image": "Womens-Rights.png"}, "createdAt": "2023-06-29T10:57:34.000Z", "published": false, "updatedAt": "2023-07-27T12:15:09.000Z", "revisionId": null, "publishedAt": "2023-06-29T10:00:00.000Z", "relatedCharts": [], "publicationContext": "listed"} | {"errors": [], "numBlocks": 0, "numErrors": 0, "wpTagCounts": {}, "htmlTagCounts": {}} | 2023-06-29 10:00:00 | 2024-02-16 14:22:55 | ["Bastian Herre", "Pablo Arriagada"] | How has the protection of women’s rights changed over time? How does it differ across countries? Explore global data on women’s rights. | 2023-06-29 10:57:34 | 2023-07-27 12:15:09 | https://ourworldindata.org/wp-content/uploads/2023/05/Womens-Rights.png | {} | {"id": 57643, "date": "2023-06-29T11:00:00", "guid": {"rendered": "https://owid.cloud/?p=57643"}, "link": "https://owid.cloud/womens-rights-launch", "meta": {"owid_publication_context_meta_field": {"latest": true, "homepage": true, "immediate_newsletter": true}}, "slug": "womens-rights-launch", "tags": [], "type": "post", "title": {"rendered": "We published a new topic page on Women’s Rights"}, "_links": {"self": [{"href": "https://owid.cloud/wp-json/wp/v2/posts/57643"}], "about": [{"href": "https://owid.cloud/wp-json/wp/v2/types/post"}], "author": [{"href": "https://owid.cloud/wp-json/wp/v2/users/49", "embeddable": true}], "curies": [{"href": "https://api.w.org/{rel}", "name": "wp", "templated": true}], "replies": [{"href": "https://owid.cloud/wp-json/wp/v2/comments?post=57643", "embeddable": true}], "wp:term": [{"href": "https://owid.cloud/wp-json/wp/v2/categories?post=57643", "taxonomy": "category", "embeddable": true}, {"href": "https://owid.cloud/wp-json/wp/v2/tags?post=57643", "taxonomy": "post_tag", "embeddable": true}], "collection": [{"href": "https://owid.cloud/wp-json/wp/v2/posts"}], "wp:attachment": [{"href": "https://owid.cloud/wp-json/wp/v2/media?parent=57643"}], "version-history": [{"href": "https://owid.cloud/wp-json/wp/v2/posts/57643/revisions", "count": 2}], "wp:featuredmedia": [{"href": "https://owid.cloud/wp-json/wp/v2/media/57051", "embeddable": true}], "predecessor-version": [{"id": 57932, "href": "https://owid.cloud/wp-json/wp/v2/posts/57643/revisions/57932"}]}, "author": 49, "format": "standard", "status": "publish", "sticky": false, "content": {"rendered": "", "protected": false}, "excerpt": {"rendered": "How has the protection of women’s rights changed over time? How does it differ across countries? Explore global data on women’s rights.", "protected": false}, "date_gmt": "2023-06-29T10:00:00", "modified": "2023-07-27T13:15:09", "template": "", "categories": [1], "ping_status": "closed", "authors_name": ["Bastian Herre", "Pablo Arriagada"], "modified_gmt": "2023-07-27T12:15:09", "c… | |||
| 1219 | 1219 | 57580 | We published a new topic page on Illicit Drug Use | drug-use-redesign | post | publish | {"id": "wp-57580", "slug": "drug-use-redesign", "content": {"toc": [], "body": [], "type": "article", "title": "We published a new topic page on Illicit Drug Use", "authors": ["Hannah Ritchie", "Pablo Arriagada"], "excerpt": "Explore global data on addiction and deaths from opioids, cocaine, and other illicit drugs.", "dateline": "June 26, 2023", "subtitle": "Explore global data on addiction and deaths from opioids, cocaine, and other illicit drugs.", "sidebar-toc": false, "featured-image": "Illicit-Drug-Use.png"}, "createdAt": "2023-06-26T10:32:16.000Z", "published": false, "updatedAt": "2023-07-27T12:17:16.000Z", "revisionId": null, "publishedAt": "2023-06-26T09:32:16.000Z", "relatedCharts": [], "publicationContext": "listed"} | {"errors": [], "numBlocks": 0, "numErrors": 0, "wpTagCounts": {}, "htmlTagCounts": {}} | 2023-06-26 09:32:16 | 2024-02-16 14:22:55 | ["Hannah Ritchie", "Pablo Arriagada"] | Explore global data on addiction and deaths from opioids, cocaine, and other illicit drugs. | 2023-06-26 10:32:16 | 2023-07-27 12:17:16 | https://ourworldindata.org/wp-content/uploads/2023/06/Illicit-Drug-Use.png | {} | {"id": 57580, "date": "2023-06-26T10:32:16", "guid": {"rendered": "https://owid.cloud/?p=57580"}, "link": "https://owid.cloud/drug-use-redesign", "meta": {"owid_publication_context_meta_field": {"latest": true, "homepage": true, "immediate_newsletter": true}}, "slug": "drug-use-redesign", "tags": [], "type": "post", "title": {"rendered": "We published a new topic page on Illicit Drug Use"}, "_links": {"self": [{"href": "https://owid.cloud/wp-json/wp/v2/posts/57580"}], "about": [{"href": "https://owid.cloud/wp-json/wp/v2/types/post"}], "author": [{"href": "https://owid.cloud/wp-json/wp/v2/users/17", "embeddable": true}], "curies": [{"href": "https://api.w.org/{rel}", "name": "wp", "templated": true}], "replies": [{"href": "https://owid.cloud/wp-json/wp/v2/comments?post=57580", "embeddable": true}], "wp:term": [{"href": "https://owid.cloud/wp-json/wp/v2/categories?post=57580", "taxonomy": "category", "embeddable": true}, {"href": "https://owid.cloud/wp-json/wp/v2/tags?post=57580", "taxonomy": "post_tag", "embeddable": true}], "collection": [{"href": "https://owid.cloud/wp-json/wp/v2/posts"}], "wp:attachment": [{"href": "https://owid.cloud/wp-json/wp/v2/media?parent=57580"}], "version-history": [{"href": "https://owid.cloud/wp-json/wp/v2/posts/57580/revisions", "count": 2}], "wp:featuredmedia": [{"href": "https://owid.cloud/wp-json/wp/v2/media/57412", "embeddable": true}], "predecessor-version": [{"id": 57937, "href": "https://owid.cloud/wp-json/wp/v2/posts/57580/revisions/57937"}]}, "author": 17, "format": "standard", "status": "publish", "sticky": false, "content": {"rendered": "", "protected": false}, "excerpt": {"rendered": "Explore global data on addiction and deaths from opioids, cocaine, and other illicit drugs.", "protected": false}, "date_gmt": "2023-06-26T09:32:16", "modified": "2023-07-27T13:17:16", "template": "", "categories": [1], "ping_status": "closed", "authors_name": ["Hannah Ritchie", "Pablo Arriagada"], "modified_gmt": "2023-07-27T12:17:16", "comment_status": "closed", "featured_media": 57412, "f… | |||
| 1218 | 1218 | 57557 | We published a new topic page on LGBT+ Rights | lgbt-rights-launch | post | publish | {"id": "wp-57557", "slug": "lgbt-rights-launch", "content": {"toc": [], "body": [], "type": "article", "title": "We published a new topic page on LGBT+ Rights", "authors": ["Bastian Herre", "Pablo Arriagada"], "excerpt": "Explore global data on the protection of LGBT+ rights across the world and over time.", "dateline": "June 22, 2023", "subtitle": "Explore global data on the protection of LGBT+ rights across the world and over time.", "sidebar-toc": false, "featured-image": "LGBT-Rights.png"}, "createdAt": "2023-06-22T10:57:56.000Z", "published": false, "updatedAt": "2023-06-22T10:03:27.000Z", "revisionId": null, "publishedAt": "2023-06-22T09:57:56.000Z", "relatedCharts": [], "publicationContext": "listed"} | {"errors": [], "numBlocks": 0, "numErrors": 0, "wpTagCounts": {}, "htmlTagCounts": {}} | 2023-06-22 09:57:56 | 2024-02-16 14:22:55 | ["Bastian Herre", "Pablo Arriagada"] | Explore global data on the protection of LGBT+ rights across the world and over time. | 2023-06-22 10:57:56 | 2023-06-22 10:03:27 | https://ourworldindata.org/wp-content/uploads/2023/05/LGBT-Rights.png | {} | {"id": 57557, "date": "2023-06-22T10:57:56", "guid": {"rendered": "https://owid.cloud/?p=57557"}, "link": "https://owid.cloud/lgbt-rights-launch", "meta": {"owid_publication_context_meta_field": {"latest": true, "homepage": true, "immediate_newsletter": true}}, "slug": "lgbt-rights-launch", "tags": [], "type": "post", "title": {"rendered": "We published a new topic page on LGBT+ Rights"}, "_links": {"self": [{"href": "https://owid.cloud/wp-json/wp/v2/posts/57557"}], "about": [{"href": "https://owid.cloud/wp-json/wp/v2/types/post"}], "author": [{"href": "https://owid.cloud/wp-json/wp/v2/users/49", "embeddable": true}], "curies": [{"href": "https://api.w.org/{rel}", "name": "wp", "templated": true}], "replies": [{"href": "https://owid.cloud/wp-json/wp/v2/comments?post=57557", "embeddable": true}], "wp:term": [{"href": "https://owid.cloud/wp-json/wp/v2/categories?post=57557", "taxonomy": "category", "embeddable": true}, {"href": "https://owid.cloud/wp-json/wp/v2/tags?post=57557", "taxonomy": "post_tag", "embeddable": true}], "collection": [{"href": "https://owid.cloud/wp-json/wp/v2/posts"}], "wp:attachment": [{"href": "https://owid.cloud/wp-json/wp/v2/media?parent=57557"}], "version-history": [{"href": "https://owid.cloud/wp-json/wp/v2/posts/57557/revisions", "count": 2}], "wp:featuredmedia": [{"href": "https://owid.cloud/wp-json/wp/v2/media/57050", "embeddable": true}], "predecessor-version": [{"id": 57560, "href": "https://owid.cloud/wp-json/wp/v2/posts/57557/revisions/57560"}]}, "author": 49, "format": "standard", "status": "publish", "sticky": false, "content": {"rendered": "", "protected": false}, "excerpt": {"rendered": "Explore global data on the protection of LGBT+ rights across the world and over time.", "protected": false}, "date_gmt": "2023-06-22T09:57:56", "modified": "2023-06-22T11:03:27", "template": "", "categories": [1], "ping_status": "closed", "authors_name": ["Bastian Herre", "Pablo Arriagada"], "modified_gmt": "2023-06-22T10:03:27", "comment_status": "closed", "featured_media": 57050, "featured_m… | |||
| 1217 | 1217 | 57534 | We published a new topic page on Hunger and Undernourishment | hunger-redesign | post | publish | {"id": "wp-57534", "slug": "hunger-redesign", "content": {"toc": [], "body": [], "type": "article", "title": "We published a new topic page on Hunger and Undernourishment", "authors": ["Hannah Ritchie", "Pablo Rosado"], "excerpt": "Explore the global data, visualizations, and writing on hunger and undernourishment. It looks at how many people are undernourished, where they are, and other metrics on food security.", "dateline": "June 19, 2023", "subtitle": "Explore the global data, visualizations, and writing on hunger and undernourishment. It looks at how many people are undernourished, where they are, and other metrics on food security.", "sidebar-toc": false, "featured-image": "Hunger-and-Undernourishment.png"}, "createdAt": "2023-06-20T15:46:34.000Z", "published": false, "updatedAt": "2023-07-27T12:16:29.000Z", "revisionId": null, "publishedAt": "2023-06-19T14:56:00.000Z", "relatedCharts": [], "publicationContext": "listed"} | {"errors": [], "numBlocks": 0, "numErrors": 0, "wpTagCounts": {}, "htmlTagCounts": {}} | 2023-06-19 14:56:00 | 2024-02-16 14:22:55 | ["Hannah Ritchie", "Pablo Rosado"] | Explore the global data, visualizations, and writing on hunger and undernourishment. It looks at how many people are undernourished, where they are, and other metrics on food security. | 2023-06-20 15:46:34 | 2023-07-27 12:16:29 | https://ourworldindata.org/wp-content/uploads/2023/06/Hunger-and-Undernourishment.png | {} | {"id": 57534, "date": "2023-06-19T15:56:00", "guid": {"rendered": "https://owid.cloud/?p=57534"}, "link": "https://owid.cloud/hunger-redesign", "meta": {"owid_publication_context_meta_field": {"latest": true, "homepage": true, "immediate_newsletter": true}}, "slug": "hunger-redesign", "tags": [127, 128], "type": "post", "title": {"rendered": "We published a new topic page on Hunger and Undernourishment"}, "_links": {"self": [{"href": "https://owid.cloud/wp-json/wp/v2/posts/57534"}], "about": [{"href": "https://owid.cloud/wp-json/wp/v2/types/post"}], "author": [{"href": "https://owid.cloud/wp-json/wp/v2/users/17", "embeddable": true}], "curies": [{"href": "https://api.w.org/{rel}", "name": "wp", "templated": true}], "replies": [{"href": "https://owid.cloud/wp-json/wp/v2/comments?post=57534", "embeddable": true}], "wp:term": [{"href": "https://owid.cloud/wp-json/wp/v2/categories?post=57534", "taxonomy": "category", "embeddable": true}, {"href": "https://owid.cloud/wp-json/wp/v2/tags?post=57534", "taxonomy": "post_tag", "embeddable": true}], "collection": [{"href": "https://owid.cloud/wp-json/wp/v2/posts"}], "wp:attachment": [{"href": "https://owid.cloud/wp-json/wp/v2/media?parent=57534"}], "version-history": [{"href": "https://owid.cloud/wp-json/wp/v2/posts/57534/revisions", "count": 5}], "wp:featuredmedia": [{"href": "https://owid.cloud/wp-json/wp/v2/media/57516", "embeddable": true}], "predecessor-version": [{"id": 57935, "href": "https://owid.cloud/wp-json/wp/v2/posts/57534/revisions/57935"}]}, "author": 17, "format": "standard", "status": "publish", "sticky": false, "content": {"rendered": "", "protected": false}, "excerpt": {"rendered": "Explore the global data, visualizations, and writing on hunger and undernourishment. It looks at how many people are undernourished, where they are, and other metrics on food security.", "protected": false}, "date_gmt": "2023-06-19T14:56:00", "modified": "2023-07-27T13:16:29", "template": "", "categories": [47], "ping_status": "closed", "authors_name": ["Hannah Ritchie", "Pabl… | |||
| 1216 | 1216 | 57528 | We published a new topic page on Mental Health | mental-health-redesign | post | publish | {"id": "wp-57528", "slug": "mental-health-redesign", "content": {"toc": [], "body": [], "type": "article", "title": "We published a new topic page on Mental Health", "authors": ["Saloni Dattani", "Lucas Rodés-Guirao"], "excerpt": "Explore global data on the prevalence of mental health illnesses, treatment, and public openness to talking about mental health. ", "dateline": "June 20, 2023", "subtitle": "Explore global data on the prevalence of mental health illnesses, treatment, and public openness to talking about mental health. ", "sidebar-toc": false, "featured-image": "mental-health-thumbnail.png"}, "createdAt": "2023-06-20T14:43:22.000Z", "published": false, "updatedAt": "2023-07-27T12:16:48.000Z", "revisionId": null, "publishedAt": "2023-06-20T16:30:00.000Z", "relatedCharts": [], "publicationContext": "listed"} | {"errors": [], "numBlocks": 0, "numErrors": 0, "wpTagCounts": {}, "htmlTagCounts": {}} | 2023-06-20 16:30:00 | 2024-02-16 14:22:55 | ["Saloni Dattani", "Lucas Rodés-Guirao"] | Explore global data on the prevalence of mental health illnesses, treatment, and public openness to talking about mental health. | 2023-06-20 14:43:22 | 2023-07-27 12:16:48 | https://ourworldindata.org/wp-content/uploads/2023/06/mental-health-thumbnail.png | {} | {"id": 57528, "date": "2023-06-20T17:30:00", "guid": {"rendered": "https://owid.cloud/?p=57528"}, "link": "https://owid.cloud/mental-health-redesign", "meta": {"owid_publication_context_meta_field": {"latest": true, "homepage": true, "immediate_newsletter": true}}, "slug": "mental-health-redesign", "tags": [], "type": "post", "title": {"rendered": "We published a new topic page on Mental Health"}, "_links": {"self": [{"href": "https://owid.cloud/wp-json/wp/v2/posts/57528"}], "about": [{"href": "https://owid.cloud/wp-json/wp/v2/types/post"}], "author": [{"href": "https://owid.cloud/wp-json/wp/v2/users/47", "embeddable": true}], "curies": [{"href": "https://api.w.org/{rel}", "name": "wp", "templated": true}], "replies": [{"href": "https://owid.cloud/wp-json/wp/v2/comments?post=57528", "embeddable": true}], "wp:term": [{"href": "https://owid.cloud/wp-json/wp/v2/categories?post=57528", "taxonomy": "category", "embeddable": true}, {"href": "https://owid.cloud/wp-json/wp/v2/tags?post=57528", "taxonomy": "post_tag", "embeddable": true}], "collection": [{"href": "https://owid.cloud/wp-json/wp/v2/posts"}], "wp:attachment": [{"href": "https://owid.cloud/wp-json/wp/v2/media?parent=57528"}], "version-history": [{"href": "https://owid.cloud/wp-json/wp/v2/posts/57528/revisions", "count": 3}], "wp:featuredmedia": [{"href": "https://owid.cloud/wp-json/wp/v2/media/57321", "embeddable": true}], "predecessor-version": [{"id": 57936, "href": "https://owid.cloud/wp-json/wp/v2/posts/57528/revisions/57936"}]}, "author": 47, "format": "standard", "status": "publish", "sticky": false, "content": {"rendered": "", "protected": false}, "excerpt": {"rendered": "Explore global data on the prevalence of mental health illnesses, treatment, and public openness to talking about mental health. ", "protected": false}, "date_gmt": "2023-06-20T16:30:00", "modified": "2023-07-27T13:16:48", "template": "", "categories": [1], "ping_status": "closed", "authors_name": ["Saloni Dattani", "Lucas Rodés-Guirao"], "modified_gmt": "2023-07-27T12:16:48", "commen… | |||
| 1215 | 1215 | 57457 | We published a new topic page on Oil Spills | oil-spills-redesign | post | publish | {"id": "wp-57457", "slug": "oil-spills-redesign", "content": {"toc": [], "body": [], "type": "article", "title": "We published a new topic page on Oil Spills", "authors": ["Hannah Ritchie", "Veronika Samborska"], "excerpt": "Explore global data on oil spills, looking at their frequency, size, and how this has changed over time.", "dateline": "June 15, 2023", "subtitle": "Explore global data on oil spills, looking at their frequency, size, and how this has changed over time.", "sidebar-toc": false, "featured-image": "Oil-Spills.png"}, "createdAt": "2023-06-15T11:26:21.000Z", "published": false, "updatedAt": "2023-07-27T12:16:14.000Z", "revisionId": null, "publishedAt": "2023-06-15T10:26:21.000Z", "relatedCharts": [], "publicationContext": "listed"} | {"errors": [], "numBlocks": 0, "numErrors": 0, "wpTagCounts": {}, "htmlTagCounts": {}} | 2023-06-15 10:26:21 | 2024-02-16 14:22:55 | ["Hannah Ritchie", "Veronika Samborska"] | Explore global data on oil spills, looking at their frequency, size, and how this has changed over time. | 2023-06-15 11:26:21 | 2023-07-27 12:16:14 | https://ourworldindata.org/wp-content/uploads/2022/12/Oil-Spills.png | {} | {"id": 57457, "date": "2023-06-15T11:26:21", "guid": {"rendered": "https://owid.cloud/?p=57457"}, "link": "https://owid.cloud/oil-spills-redesign", "meta": {"owid_publication_context_meta_field": {"latest": true, "homepage": true, "immediate_newsletter": true}}, "slug": "oil-spills-redesign", "tags": [], "type": "post", "title": {"rendered": "We published a new topic page on Oil Spills"}, "_links": {"self": [{"href": "https://owid.cloud/wp-json/wp/v2/posts/57457"}], "about": [{"href": "https://owid.cloud/wp-json/wp/v2/types/post"}], "author": [{"href": "https://owid.cloud/wp-json/wp/v2/users/17", "embeddable": true}], "curies": [{"href": "https://api.w.org/{rel}", "name": "wp", "templated": true}], "replies": [{"href": "https://owid.cloud/wp-json/wp/v2/comments?post=57457", "embeddable": true}], "wp:term": [{"href": "https://owid.cloud/wp-json/wp/v2/categories?post=57457", "taxonomy": "category", "embeddable": true}, {"href": "https://owid.cloud/wp-json/wp/v2/tags?post=57457", "taxonomy": "post_tag", "embeddable": true}], "collection": [{"href": "https://owid.cloud/wp-json/wp/v2/posts"}], "wp:attachment": [{"href": "https://owid.cloud/wp-json/wp/v2/media?parent=57457"}], "version-history": [{"href": "https://owid.cloud/wp-json/wp/v2/posts/57457/revisions", "count": 3}], "wp:featuredmedia": [{"href": "https://owid.cloud/wp-json/wp/v2/media/54742", "embeddable": true}], "predecessor-version": [{"id": 57934, "href": "https://owid.cloud/wp-json/wp/v2/posts/57457/revisions/57934"}]}, "author": 17, "format": "standard", "status": "publish", "sticky": false, "content": {"rendered": "", "protected": false}, "excerpt": {"rendered": "Explore global data on oil spills, looking at their frequency, size, and how this has changed over time.", "protected": false}, "date_gmt": "2023-06-15T10:26:21", "modified": "2023-07-27T13:16:14", "template": "", "categories": [1], "ping_status": "closed", "authors_name": ["Hannah Ritchie", "Veronika Samborska"], "modified_gmt": "2023-07-27T12:16:14", "comment_status": "closed", "featured_med… | |||
| 1214 | 1214 | 57446 | We published a new topic page on Crop Yields | crop-yield-redesign | post | publish | {"id": "wp-57446", "slug": "crop-yield-redesign", "content": {"toc": [], "body": [], "type": "article", "title": "We published a new topic page on Crop Yields", "authors": ["Hannah Ritchie"], "excerpt": "Explore global data on crop yields, their changes over time, and remaining yield gaps.", "dateline": "June 14, 2023", "subtitle": "Explore global data on crop yields, their changes over time, and remaining yield gaps.", "sidebar-toc": false, "featured-image": "Crop-Yields.png"}, "createdAt": "2023-06-14T16:29:20.000Z", "published": false, "updatedAt": "2023-07-27T12:15:51.000Z", "revisionId": null, "publishedAt": "2023-06-14T15:29:20.000Z", "relatedCharts": [], "publicationContext": "listed"} | {"errors": [], "numBlocks": 0, "numErrors": 0, "wpTagCounts": {}, "htmlTagCounts": {}} | 2023-06-14 15:29:20 | 2024-02-16 14:22:55 | ["Hannah Ritchie"] | Explore global data on crop yields, their changes over time, and remaining yield gaps. | 2023-06-14 16:29:20 | 2023-07-27 12:15:51 | https://ourworldindata.org/wp-content/uploads/2023/05/Crop-Yields.png | {} | {"id": 57446, "date": "2023-06-14T16:29:20", "guid": {"rendered": "https://owid.cloud/?p=57446"}, "link": "https://owid.cloud/crop-yield-redesign", "meta": {"owid_publication_context_meta_field": {"latest": true, "homepage": true, "immediate_newsletter": true}}, "slug": "crop-yield-redesign", "tags": [], "type": "post", "title": {"rendered": "We published a new topic page on Crop Yields"}, "_links": {"self": [{"href": "https://owid.cloud/wp-json/wp/v2/posts/57446"}], "about": [{"href": "https://owid.cloud/wp-json/wp/v2/types/post"}], "author": [{"href": "https://owid.cloud/wp-json/wp/v2/users/17", "embeddable": true}], "curies": [{"href": "https://api.w.org/{rel}", "name": "wp", "templated": true}], "replies": [{"href": "https://owid.cloud/wp-json/wp/v2/comments?post=57446", "embeddable": true}], "wp:term": [{"href": "https://owid.cloud/wp-json/wp/v2/categories?post=57446", "taxonomy": "category", "embeddable": true}, {"href": "https://owid.cloud/wp-json/wp/v2/tags?post=57446", "taxonomy": "post_tag", "embeddable": true}], "collection": [{"href": "https://owid.cloud/wp-json/wp/v2/posts"}], "wp:attachment": [{"href": "https://owid.cloud/wp-json/wp/v2/media?parent=57446"}], "version-history": [{"href": "https://owid.cloud/wp-json/wp/v2/posts/57446/revisions", "count": 3}], "wp:featuredmedia": [{"href": "https://owid.cloud/wp-json/wp/v2/media/57270", "embeddable": true}], "predecessor-version": [{"id": 57933, "href": "https://owid.cloud/wp-json/wp/v2/posts/57446/revisions/57933"}]}, "author": 17, "format": "standard", "status": "publish", "sticky": false, "content": {"rendered": "", "protected": false}, "excerpt": {"rendered": "Explore global data on crop yields, their changes over time, and remaining yield gaps.", "protected": false}, "date_gmt": "2023-06-14T15:29:20", "modified": "2023-07-27T13:15:51", "template": "", "categories": [1], "ping_status": "closed", "authors_name": ["Hannah Ritchie"], "modified_gmt": "2023-07-27T12:15:51", "comment_status": "closed", "featured_media": 57270, "featured_media_paths": {"t… | |||
| 1211 | 1211 | 57249 | We published a new topic page on Research & Development | rd-launch | post | publish | {"id": "wp-57249", "slug": "rd-launch", "content": {"toc": [], "body": [], "type": "article", "title": "We published a new topic page on Research & Development", "authors": ["Hannah Ritchie", "Edouard Mathieu"], "excerpt": "Explore global data on patents, researchers, R&D spending and innovation across the world.", "dateline": "May 30, 2023", "subtitle": "Explore global data on patents, researchers, R&D spending and innovation across the world.", "sidebar-toc": false, "featured-image": "Research-and-Development.png"}, "createdAt": "2023-05-30T11:31:45.000Z", "published": false, "updatedAt": "2023-05-30T10:35:54.000Z", "revisionId": null, "publishedAt": "2023-05-30T10:31:45.000Z", "relatedCharts": [], "publicationContext": "listed"} | {"errors": [], "numBlocks": 0, "numErrors": 0, "wpTagCounts": {}, "htmlTagCounts": {}} | 2023-05-30 10:31:45 | 2024-02-16 14:22:55 | ["Hannah Ritchie", "Edouard Mathieu"] | Explore global data on patents, researchers, R&D spending and innovation across the world. | 2023-05-30 11:31:45 | 2023-05-30 10:35:54 | https://ourworldindata.org/wp-content/uploads/2023/01/Research-and-Development.png | {} | {"id": 57249, "date": "2023-05-30T11:31:45", "guid": {"rendered": "https://owid.cloud/?p=57249"}, "link": "https://owid.cloud/rd-launch", "meta": {"owid_publication_context_meta_field": {"latest": true, "homepage": true, "immediate_newsletter": true}}, "slug": "rd-launch", "tags": [], "type": "post", "title": {"rendered": "We published a new topic page on Research & Development"}, "_links": {"self": [{"href": "https://owid.cloud/wp-json/wp/v2/posts/57249"}], "about": [{"href": "https://owid.cloud/wp-json/wp/v2/types/post"}], "author": [{"href": "https://owid.cloud/wp-json/wp/v2/users/17", "embeddable": true}], "curies": [{"href": "https://api.w.org/{rel}", "name": "wp", "templated": true}], "replies": [{"href": "https://owid.cloud/wp-json/wp/v2/comments?post=57249", "embeddable": true}], "wp:term": [{"href": "https://owid.cloud/wp-json/wp/v2/categories?post=57249", "taxonomy": "category", "embeddable": true}, {"href": "https://owid.cloud/wp-json/wp/v2/tags?post=57249", "taxonomy": "post_tag", "embeddable": true}], "collection": [{"href": "https://owid.cloud/wp-json/wp/v2/posts"}], "wp:attachment": [{"href": "https://owid.cloud/wp-json/wp/v2/media?parent=57249"}], "version-history": [{"href": "https://owid.cloud/wp-json/wp/v2/posts/57249/revisions", "count": 2}], "wp:featuredmedia": [{"href": "https://owid.cloud/wp-json/wp/v2/media/55545", "embeddable": true}], "predecessor-version": [{"id": 57253, "href": "https://owid.cloud/wp-json/wp/v2/posts/57249/revisions/57253"}]}, "author": 17, "format": "standard", "status": "publish", "sticky": false, "content": {"rendered": "", "protected": false}, "excerpt": {"rendered": "Explore global data on patents, researchers, R&D spending and innovation across the world.", "protected": false}, "date_gmt": "2023-05-30T10:31:45", "modified": "2023-05-30T11:35:54", "template": "", "categories": [1], "ping_status": "closed", "authors_name": ["Hannah Ritchie", "Edouard Mathieu"], "modified_gmt": "2023-05-30T10:35:54", "comment_status": "closed", "featured_media": 55545, "fe… | |||
| 1210 | 1210 | 57186 | How are mental illnesses defined? | how-are-mental-illnesses-defined | post | publish | <!-- wp:paragraph -->
<p>Mental illnesses are diagnosed by health professionals using manuals, which describe their symptoms, their context, and how they differ from similar conditions.</p>
<!-- /wp:paragraph -->
<!-- wp:paragraph -->
<p>How are these manuals used? How are major mental illnesses described and diagnosed?</p>
<!-- /wp:paragraph -->
<!-- wp:paragraph -->
<p>This article summarizes the major mental illnesses in the ICD-11 manual, the official worldwide classification.</p>
<!-- /wp:paragraph -->
<!-- wp:paragraph -->
<p>Each section includes a summary of how the condition is medically diagnosed, a description of the symptoms, and other conditions that must be ruled out before making a diagnosis.</p>
<!-- /wp:paragraph -->
<!-- wp:paragraph -->
<p>If you want to read the full criteria for diagnosing mental illnesses according to the ICD-11, you can find them <a href="https://icd.who.int/browse11/l-m/en#/http%3a%2f%2fid.who.int%2ficd%2fentity%2f334423054">here</a>.</p>
<!-- /wp:paragraph -->
<!-- wp:heading {"level":3} -->
<h3>What are the different manuals in use?</h3>
<!-- /wp:heading -->
<!-- wp:paragraph -->
<p>Diagnosing a mental illness begins when people see a doctor or psychiatrist.</p>
<!-- /wp:paragraph -->
<!-- wp:paragraph -->
<p>It can be difficult to define mental illnesses because they are conditions of the mind: they are diagnosed according to people's symptoms and behavior. This means they can be subjective – they are dependent partly on people’s comfort seeing a doctor or psychiatrist, the training and experiences of healthcare professionals, and other cultural factors.</p>
<!-- /wp:paragraph -->
<!-- wp:paragraph -->
<p>Two manuals are commonly used by doctors and psychiatrists to diagnose mental illnesses: the <strong>International Classification of Diseases (ICD)</strong> and the <strong>Diagnostic and Statistical Manual of Mental Disorders (DSM)</strong>. </p>
<!-- /wp:paragraph -->
<!-- wp:paragraph -->
<p>There are differences in how they are used.</p>
<!-- /wp:para… |
{"id": "wp-57186", "slug": "how-are-mental-illnesses-defined", "content": {"toc": [], "body": [{"type": "text", "value": [{"text": "Mental illnesses are diagnosed by health professionals using manuals, which describe their symptoms, their context, and how they differ from similar conditions.", "spanType": "span-simple-text"}], "parseErrors": []}, {"type": "text", "value": [{"text": "How are these manuals used? How are major mental illnesses described and diagnosed?", "spanType": "span-simple-text"}], "parseErrors": []}, {"type": "text", "value": [{"text": "This article summarizes the major mental illnesses in the ICD-11 manual, the official worldwide classification.", "spanType": "span-simple-text"}], "parseErrors": []}, {"type": "text", "value": [{"text": "Each section includes a summary of how the condition is medically diagnosed, a description of the symptoms, and other conditions that must be ruled out before making a diagnosis.", "spanType": "span-simple-text"}], "parseErrors": []}, {"type": "text", "value": [{"text": "If you want to read the full criteria for diagnosing mental illnesses according to the ICD-11, you can find them ", "spanType": "span-simple-text"}, {"url": "https://icd.who.int/browse11/l-m/en#/http%3a%2f%2fid.who.int%2ficd%2fentity%2f334423054", "children": [{"text": "here", "spanType": "span-simple-text"}], "spanType": "span-link"}, {"text": ".", "spanType": "span-simple-text"}], "parseErrors": []}, {"text": [{"text": "What are the different manuals in use?", "spanType": "span-simple-text"}], "type": "heading", "level": 2, "parseErrors": []}, {"type": "text", "value": [{"text": "Diagnosing a mental illness begins when people see a doctor or psychiatrist.", "spanType": "span-simple-text"}], "parseErrors": []}, {"type": "text", "value": [{"text": "It can be difficult to define mental illnesses because they are conditions of the mind: they are diagnosed according to people's symptoms and behavior. This means they can be subjective – they are dependent partly on people’s comfort seeing a doctor… | {"errors": [{"name": "unexpected wp component tag", "details": "Found unhandled wp:comment tag list"}, {"name": "unexpected wp component tag", "details": "Found unhandled wp:comment tag list"}, {"name": "unexpected wp component tag", "details": "Found unhandled wp:comment tag list"}, {"name": "unexpected wp component tag", "details": "Found unhandled wp:comment tag list"}, {"name": "unexpected wp component tag", "details": "Found unhandled wp:comment tag list"}, {"name": "unexpected wp component tag", "details": "Found unhandled wp:comment tag list"}, {"name": "unexpected wp component tag", "details": "Found unhandled wp:comment tag list"}, {"name": "unexpected wp component tag", "details": "Found unhandled wp:comment tag list"}, {"name": "unhandled html tag found", "details": "Encountered the unhandled tag hr"}, {"name": "unexpected wp component tag", "details": "Found unhandled wp:comment tag separator"}, {"name": "prominent link missing title", "details": "Prominent link is missing a title attribute"}, {"name": "unhandled html tag found", "details": "Encountered the unhandled tag hr"}, {"name": "unexpected wp component tag", "details": "Found unhandled wp:comment tag separator"}], "numBlocks": 56, "numErrors": 13, "wpTagCounts": {"html": 6, "list": 8, "column": 18, "columns": 9, "heading": 18, "paragraph": 78, "separator": 2, "owid/prominent-link": 2}, "htmlTagCounts": {"p": 78, "h3": 10, "h4": 8, "hr": 2, "ol": 3, "ul": 5, "div": 27, "iframe": 6}} | 2023-05-26 18:47:36 | 2024-02-16 14:22:55 | 1YcRucigIcArW7S7ingWu53XJNMUh3douSARBDzNv4z8 | ["Saloni Dattani"] | Mental illnesses are a range of conditions that significantly affect people’s lives. What are their symptoms? | 2023-05-26 15:14:47 | 2023-07-10 16:27:34 | https://ourworldindata.org/wp-content/uploads/2023/06/Mental-illnesses-defined-thumbnail.png | {} | Mental illnesses are diagnosed by health professionals using manuals, which describe their symptoms, their context, and how they differ from similar conditions. How are these manuals used? How are major mental illnesses described and diagnosed? This article summarizes the major mental illnesses in the ICD-11 manual, the official worldwide classification. Each section includes a summary of how the condition is medically diagnosed, a description of the symptoms, and other conditions that must be ruled out before making a diagnosis. If you want to read the full criteria for diagnosing mental illnesses according to the ICD-11, you can find them [here](https://icd.who.int/browse11/l-m/en#/http%3a%2f%2fid.who.int%2ficd%2fentity%2f334423054). ## What are the different manuals in use? Diagnosing a mental illness begins when people see a doctor or psychiatrist. It can be difficult to define mental illnesses because they are conditions of the mind: they are diagnosed according to people's symptoms and behavior. This means they can be subjective – they are dependent partly on people’s comfort seeing a doctor or psychiatrist, the training and experiences of healthcare professionals, and other cultural factors. Two manuals are commonly used by doctors and psychiatrists to diagnose mental illnesses: the **International Classification of Diseases (ICD)** and the **Diagnostic and Statistical Manual of Mental Disorders (DSM)**. There are differences in how they are used. The ICD is the official worldwide classification for healthcare and data collection. It is used by a wide range of healthcare professionals. In contrast, the DSM was developed for psychiatrists in the United States, although its usage has expanded worldwide. It is intended to provide standardized guidelines for different psychiatrists who may have different judgments otherwise.{ref}Harrison, J. E., Weber, S., Jakob, R., & Chute, C. G. (2021). ICD-11: An international classification of diseases for the twenty-first century. BMC Medical Informatics and… | {"id": 57186, "date": "2023-05-26T19:47:36", "guid": {"rendered": "https://owid.cloud/?p=57186"}, "link": "https://owid.cloud/how-are-mental-illnesses-defined", "meta": {"owid_publication_context_meta_field": {"latest": true, "homepage": true, "immediate_newsletter": true}}, "slug": "how-are-mental-illnesses-defined", "tags": [122], "type": "post", "title": {"rendered": "How are mental illnesses defined?"}, "_links": {"self": [{"href": "https://owid.cloud/wp-json/wp/v2/posts/57186"}], "about": [{"href": "https://owid.cloud/wp-json/wp/v2/types/post"}], "author": [{"href": "https://owid.cloud/wp-json/wp/v2/users/47", "embeddable": true}], "curies": [{"href": "https://api.w.org/{rel}", "name": "wp", "templated": true}], "replies": [{"href": "https://owid.cloud/wp-json/wp/v2/comments?post=57186", "embeddable": true}], "wp:term": [{"href": "https://owid.cloud/wp-json/wp/v2/categories?post=57186", "taxonomy": "category", "embeddable": true}, {"href": "https://owid.cloud/wp-json/wp/v2/tags?post=57186", "taxonomy": "post_tag", "embeddable": true}], "collection": [{"href": "https://owid.cloud/wp-json/wp/v2/posts"}], "wp:attachment": [{"href": "https://owid.cloud/wp-json/wp/v2/media?parent=57186"}], "version-history": [{"href": "https://owid.cloud/wp-json/wp/v2/posts/57186/revisions", "count": 21}], "wp:featuredmedia": [{"href": "https://owid.cloud/wp-json/wp/v2/media/57426", "embeddable": true}], "predecessor-version": [{"id": 57461, "href": "https://owid.cloud/wp-json/wp/v2/posts/57186/revisions/57461"}]}, "author": 47, "format": "standard", "status": "publish", "sticky": false, "content": {"rendered": "\n<p>Mental illnesses are diagnosed by health professionals using manuals, which describe their symptoms, their context, and how they differ from similar conditions.</p>\n\n\n\n<p>How are these manuals used? How are major mental illnesses described and diagnosed?</p>\n\n\n\n<p>This article summarizes the major mental illnesses in the ICD-11 manual, the official worldwide classification.</p>\n\n\n\n<p>Each section includes… |
| 1209 | 1209 | 57166 | How do researchers study the prevalence of mental illnesses? | how-do-researchers-study-the-prevalence-of-mental-illnesses | post | publish | <!-- wp:paragraph -->
<p>In many countries, many people with mental illnesses go undiagnosed, meaning mental health is given less attention and support than it deserves. Even for those diagnosed, treatment can be of poor quality, if they receive it at all.{ref}Alonso, J., Liu, Z., Evans‐Lacko, S., Sadikova, E., Sampson, N., Chatterji, S., ... & WHO World Mental Health Survey Collaborators. (2018). Treatment gap for anxiety disorders is global: Results of the World Mental Health Surveys in 21 countries. Depression and anxiety, 35(3), 195-208. <a href="https://doi.org/10.1002/da.22711">https://doi.org/10.1002/da.22711</a> {/ref}</p>
<!-- /wp:paragraph -->
<!-- wp:paragraph -->
<p>To reduce the burden of mental illnesses, the world needs reliable data, which includes the number of people that face mental illnesses, how and when they occur, and the effectiveness of treatments.</p>
<!-- /wp:paragraph -->
<!-- wp:heading {"level":3} -->
<h3>How are mental illnesses defined?</h3>
<!-- /wp:heading -->
<!-- wp:columns -->
<div class="wp-block-columns"><!-- wp:column -->
<div class="wp-block-column"><!-- wp:paragraph -->
<p>Defining mental illnesses is complex. They are diagnosed based on people’s psychological symptoms and behavior rather than biomarkers, brain scans, or blood tests. This makes them more subjective – they are dependent on whether people share their symptoms and the way doctors diagnose them.</p>
<!-- /wp:paragraph -->
<!-- wp:paragraph -->
<p>Mental illnesses are formally defined according to the International Classification of Diseases (ICD) and the Diagnostic and Statistical Manual of Mental Disorders (DSM). The ICD is used internationally by healthcare professionals, while the DSM is primarily used by psychiatrists in the United States.{ref}Kupfer, D. J., Regier, D. A., & Kuhl, E. A. (2008). On the road to DSM-V and ICD-11. European Archives of Psychiatry and Clinical Neuroscience, 258(S5), 2–6. <a href="https://doi.org/10.1007/s00406-008-5002-6">https://doi.org/10.1007/s00406-008-5002-6</a… |
{"id": "wp-57166", "slug": "how-do-researchers-study-the-prevalence-of-mental-illnesses", "content": {"toc": [], "body": [{"type": "text", "value": [{"text": "In many countries, many people with mental illnesses go undiagnosed, meaning mental health is given less attention and support than it deserves. Even for those diagnosed, treatment can be of poor quality, if they receive it at all.{ref}Alonso, J., Liu, Z., Evans‐Lacko, S., Sadikova, E., Sampson, N., Chatterji, S., ... & WHO World Mental Health Survey Collaborators. (2018). Treatment gap for anxiety disorders is global: Results of the World Mental Health Surveys in 21 countries. Depression and anxiety, 35(3), 195-208. ", "spanType": "span-simple-text"}, {"url": "https://doi.org/10.1002/da.22711", "children": [{"text": "https://doi.org/10.1002/da.22711", "spanType": "span-simple-text"}], "spanType": "span-link"}, {"text": " {/ref}", "spanType": "span-simple-text"}], "parseErrors": []}, {"type": "text", "value": [{"text": "To reduce the burden of mental illnesses, the world needs reliable data, which includes the number of people that face mental illnesses, how and when they occur, and the effectiveness of treatments.", "spanType": "span-simple-text"}], "parseErrors": []}, {"text": [{"text": "How are mental illnesses defined?", "spanType": "span-simple-text"}], "type": "heading", "level": 2, "parseErrors": []}, {"type": "text", "value": [{"text": "Defining mental illnesses is complex. They are diagnosed based on people’s psychological symptoms and behavior rather than biomarkers, brain scans, or blood tests. This makes them more subjective – they are dependent on whether people share their symptoms and the way doctors diagnose them.", "spanType": "span-simple-text"}], "parseErrors": []}, {"type": "text", "value": [{"text": "Mental illnesses are formally defined according to the International Classification of Diseases (ICD) and the Diagnostic and Statistical Manual of Mental Disorders (DSM). The ICD is used internationally by healthcare professionals, while th… | {"errors": [{"name": "unexpected wp component tag", "details": "Found unhandled wp:comment tag image"}, {"name": "unhandled html tag found", "details": "Encountered the unhandled tag hr"}, {"name": "unexpected wp component tag", "details": "Found unhandled wp:comment tag separator"}, {"name": "prominent link missing title", "details": "Prominent link is missing a title attribute"}, {"name": "unhandled html tag found", "details": "Encountered the unhandled tag hr"}, {"name": "unexpected wp component tag", "details": "Found unhandled wp:comment tag separator"}], "numBlocks": 70, "numErrors": 6, "wpTagCounts": {"html": 5, "image": 1, "column": 26, "columns": 13, "heading": 12, "paragraph": 87, "separator": 2, "owid/prominent-link": 2}, "htmlTagCounts": {"p": 87, "h3": 8, "h4": 4, "hr": 2, "div": 39, "figure": 1, "iframe": 5}} | 2023-05-26 19:00:00 | 2024-02-16 14:22:55 | 1CKEuPmKy4VP8WTSlF6oOQN761LQyxhaoAzVm6yu5dUE | ["Saloni Dattani"] | Global data on mental health is essential to understand the scale and patterns of these illnesses, and how to reduce them. How do researchers collect this data, and how reliable is it? | 2023-05-26 11:49:27 | 2023-07-10 16:26:58 | https://ourworldindata.org/wp-content/uploads/2023/05/Researchers-estimate-mental-health-thumbnail.png | {} | In many countries, many people with mental illnesses go undiagnosed, meaning mental health is given less attention and support than it deserves. Even for those diagnosed, treatment can be of poor quality, if they receive it at all.{ref}Alonso, J., Liu, Z., Evans‐Lacko, S., Sadikova, E., Sampson, N., Chatterji, S., ... & WHO World Mental Health Survey Collaborators. (2018). Treatment gap for anxiety disorders is global: Results of the World Mental Health Surveys in 21 countries. Depression and anxiety, 35(3), 195-208. [https://doi.org/10.1002/da.22711](https://doi.org/10.1002/da.22711) {/ref} To reduce the burden of mental illnesses, the world needs reliable data, which includes the number of people that face mental illnesses, how and when they occur, and the effectiveness of treatments. ## How are mental illnesses defined? Defining mental illnesses is complex. They are diagnosed based on people’s psychological symptoms and behavior rather than biomarkers, brain scans, or blood tests. This makes them more subjective – they are dependent on whether people share their symptoms and the way doctors diagnose them. Mental illnesses are formally defined according to the International Classification of Diseases (ICD) and the Diagnostic and Statistical Manual of Mental Disorders (DSM). The ICD is used internationally by healthcare professionals, while the DSM is primarily used by psychiatrists in the United States.{ref}Kupfer, D. J., Regier, D. A., & Kuhl, E. A. (2008). On the road to DSM-V and ICD-11. European Archives of Psychiatry and Clinical Neuroscience, 258(S5), 2–6. [https://doi.org/10.1007/s00406-008-5002-6](https://doi.org/10.1007/s00406-008-5002-6) {/ref} These manuals explain how to diagnose mental illnesses by observing and asking about people’s symptoms and behavior, and the context of their symptoms – for example, symptoms that appeared because of drug use or other medical conditions don’t qualify as mental illnesses. Based on these definitions, healthcare professionals can make diagnoses, which can be… | {"id": 57166, "date": "2023-05-26T20:00:00", "guid": {"rendered": "https://owid.cloud/?p=57166"}, "link": "https://owid.cloud/how-do-researchers-study-the-prevalence-of-mental-illnesses", "meta": {"owid_publication_context_meta_field": {"latest": true, "homepage": true, "immediate_newsletter": true}}, "slug": "how-do-researchers-study-the-prevalence-of-mental-illnesses", "tags": [122], "type": "post", "title": {"rendered": "How do researchers study the prevalence of mental illnesses?"}, "_links": {"self": [{"href": "https://owid.cloud/wp-json/wp/v2/posts/57166"}], "about": [{"href": "https://owid.cloud/wp-json/wp/v2/types/post"}], "author": [{"href": "https://owid.cloud/wp-json/wp/v2/users/47", "embeddable": true}], "curies": [{"href": "https://api.w.org/{rel}", "name": "wp", "templated": true}], "replies": [{"href": "https://owid.cloud/wp-json/wp/v2/comments?post=57166", "embeddable": true}], "wp:term": [{"href": "https://owid.cloud/wp-json/wp/v2/categories?post=57166", "taxonomy": "category", "embeddable": true}, {"href": "https://owid.cloud/wp-json/wp/v2/tags?post=57166", "taxonomy": "post_tag", "embeddable": true}], "collection": [{"href": "https://owid.cloud/wp-json/wp/v2/posts"}], "wp:attachment": [{"href": "https://owid.cloud/wp-json/wp/v2/media?parent=57166"}], "version-history": [{"href": "https://owid.cloud/wp-json/wp/v2/posts/57166/revisions", "count": 22}], "wp:featuredmedia": [{"href": "https://owid.cloud/wp-json/wp/v2/media/57185", "embeddable": true}], "predecessor-version": [{"id": 57238, "href": "https://owid.cloud/wp-json/wp/v2/posts/57166/revisions/57238"}]}, "author": 47, "format": "standard", "status": "publish", "sticky": false, "content": {"rendered": "\n<p>In many countries, many people with mental illnesses go undiagnosed, meaning mental health is given less attention and support than it deserves. Even for those diagnosed, treatment can be of poor quality, if they receive it at all.{ref}Alonso, J., Liu, Z., Evans‐Lacko, S., Sadikova, E., Sampson, N., Chatterji, S., … & WHO World… |
| 1207 | 1207 | 56984 | We published a new topic page on Influenza | influenza-launch | post | publish | {"id": "wp-56984", "slug": "influenza-launch", "content": {"toc": [], "body": [], "type": "article", "title": "We published a new topic page on Influenza", "authors": ["Saloni Dattani", "Fiona Spooner"], "excerpt": "Explore global data on influenza cases, deaths, and vaccinations.", "dateline": "May 18, 2023", "subtitle": "Explore global data on influenza cases, deaths, and vaccinations.", "sidebar-toc": false, "featured-image": "flu-topic-page-thumbnail.png"}, "createdAt": "2023-05-17T09:16:57.000Z", "published": false, "updatedAt": "2023-05-18T09:25:21.000Z", "revisionId": null, "publishedAt": "2023-05-18T08:16:00.000Z", "relatedCharts": [], "publicationContext": "listed"} | {"errors": [], "numBlocks": 0, "numErrors": 0, "wpTagCounts": {}, "htmlTagCounts": {}} | 2023-05-18 08:16:00 | 2024-02-16 14:22:55 | ["Saloni Dattani", "Fiona Spooner"] | Explore global data on influenza cases, deaths, and vaccinations. | 2023-05-17 09:16:57 | 2023-05-18 09:25:21 | https://ourworldindata.org/wp-content/uploads/2023/05/flu-topic-page-thumbnail.png | {} | {"id": 56984, "date": "2023-05-18T09:16:00", "guid": {"rendered": "https://owid.cloud/?p=56984"}, "link": "https://owid.cloud/influenza-launch", "meta": {"owid_publication_context_meta_field": {"latest": true, "homepage": true, "immediate_newsletter": true}}, "slug": "influenza-launch", "tags": [], "type": "post", "title": {"rendered": "We published a new topic page on Influenza"}, "_links": {"self": [{"href": "https://owid.cloud/wp-json/wp/v2/posts/56984"}], "about": [{"href": "https://owid.cloud/wp-json/wp/v2/types/post"}], "author": [{"href": "https://owid.cloud/wp-json/wp/v2/users/47", "embeddable": true}], "curies": [{"href": "https://api.w.org/{rel}", "name": "wp", "templated": true}], "replies": [{"href": "https://owid.cloud/wp-json/wp/v2/comments?post=56984", "embeddable": true}], "wp:term": [{"href": "https://owid.cloud/wp-json/wp/v2/categories?post=56984", "taxonomy": "category", "embeddable": true}, {"href": "https://owid.cloud/wp-json/wp/v2/tags?post=56984", "taxonomy": "post_tag", "embeddable": true}], "collection": [{"href": "https://owid.cloud/wp-json/wp/v2/posts"}], "wp:attachment": [{"href": "https://owid.cloud/wp-json/wp/v2/media?parent=56984"}], "version-history": [{"href": "https://owid.cloud/wp-json/wp/v2/posts/56984/revisions", "count": 2}], "wp:featuredmedia": [{"href": "https://owid.cloud/wp-json/wp/v2/media/56858", "embeddable": true}], "predecessor-version": [{"id": 56988, "href": "https://owid.cloud/wp-json/wp/v2/posts/56984/revisions/56988"}]}, "author": 47, "format": "standard", "status": "publish", "sticky": false, "content": {"rendered": "", "protected": false}, "excerpt": {"rendered": "Explore global data on influenza cases, deaths, and vaccinations.", "protected": false}, "date_gmt": "2023-05-18T08:16:00", "modified": "2023-05-18T10:25:21", "template": "", "categories": [1], "ping_status": "closed", "authors_name": ["Saloni Dattani", "Fiona Spooner"], "modified_gmt": "2023-05-18T09:25:21", "comment_status": "closed", "featured_media": 56858, "featured_media_paths": {"thumbnail": "… | |||
| 1205 | 1205 | 56935 | LGBT+ Rights | lgbt-rights | page | publish | <!-- wp:owid/front-matter -->
<!-- wp:columns {"className":"front-matter"} -->
<div class="wp-block-columns front-matter"><!-- wp:column -->
<div class="wp-block-column"><!-- wp:group {"className":"related-topics"} -->
<div class="wp-block-group related-topics"><!-- wp:paragraph -->
<p>This page is now maintained in Google Docs: <a href="https://owid.cloud/admin/gdocs/1RvMWl3OpP6zrygM49jcvI6SotoWWq5er14gLBnPLxUg/preview">https://owid.cloud/admin/gdocs/1RvMWl3OpP6zrygM49jcvI6SotoWWq5er14gLBnPLxUg/preview</a></p>
<!-- /wp:paragraph --></div>
<!-- /wp:group --></div>
<!-- /wp:column --></div>
<!-- /wp:columns -->
<!-- /wp:owid/front-matter --> |
{"id": "wp-56935", "slug": "lgbt-rights", "content": {"toc": [], "body": [{"type": "text", "value": [{"text": "This page is now maintained in Google Docs: ", "spanType": "span-simple-text"}, {"url": "https://owid.cloud/admin/gdocs/1RvMWl3OpP6zrygM49jcvI6SotoWWq5er14gLBnPLxUg/preview", "children": [{"text": "https://owid.cloud/admin/gdocs/1RvMWl3OpP6zrygM49jcvI6SotoWWq5er14gLBnPLxUg/preview", "spanType": "span-simple-text"}], "spanType": "span-link"}], "parseErrors": []}], "type": "article", "title": "LGBT+ Rights", "authors": ["Bastian Herre", "Pablo Arriagada", "Max Roser"], "excerpt": "How has the protection of LGBT+ rights changed over time? How does it differ across countries? Explore global data on LGBT+ rights.", "dateline": "May 12, 2023", "subtitle": "How has the protection of LGBT+ rights changed over time? How does it differ across countries? Explore global data on LGBT+ rights.", "sidebar-toc": false, "featured-image": "LGBT-Rights.png"}, "createdAt": "2023-05-12T14:00:32.000Z", "published": false, "updatedAt": "2023-07-18T17:49:02.000Z", "revisionId": null, "publishedAt": "2023-05-12T13:02:45.000Z", "relatedCharts": [], "publicationContext": "listed"} | {"errors": [{"name": "unexpected wp component tag", "details": "Found unhandled wp:comment tag group"}, {"name": "columns block expects 2 children", "details": "Got 1 children instead"}, {"name": "unexpected wp component tag", "details": "Found unhandled wp:comment tag owid/front-matter"}], "numBlocks": 1, "numErrors": 3, "wpTagCounts": {"group": 1, "column": 1, "columns": 1, "paragraph": 1, "owid/front-matter": 1}, "htmlTagCounts": {"p": 1, "div": 3}} | 2023-05-12 13:02:45 | 2024-03-05 09:19:03 | ["Bastian Herre", "Pablo Arriagada"] | How has the protection of LGBT+ rights changed over time? How does it differ across countries? Explore global data on LGBT+ rights. | 2023-05-12 14:00:32 | 2023-07-18 17:49:02 | https://ourworldindata.org/wp-content/uploads/2023/05/LGBT-Rights.png | {} | This page is now maintained in Google Docs: [https://owid.cloud/admin/gdocs/1RvMWl3OpP6zrygM49jcvI6SotoWWq5er14gLBnPLxUg/preview](https://owid.cloud/admin/gdocs/1RvMWl3OpP6zrygM49jcvI6SotoWWq5er14gLBnPLxUg/preview) | {"id": 56935, "date": "2023-05-12T14:02:45", "guid": {"rendered": "https://owid.cloud/?page_id=56935"}, "link": "https://owid.cloud/lgbt-rights", "meta": {"owid_publication_context_meta_field": [], "owid_key_performance_indicators_meta_field": {"raw": "LGBT+ rights are much more protected than in the past, but are often a lot less protected than those of straight and cisgender people.", "rendered": "<p>LGBT+ rights are much more protected than in the past, but are often a lot less protected than those of straight and cisgender people.</p>\n"}}, "slug": "lgbt-rights", "tags": [251], "type": "page", "title": {"rendered": "LGBT+ Rights"}, "_links": {"self": [{"href": "https://owid.cloud/wp-json/wp/v2/pages/56935"}], "about": [{"href": "https://owid.cloud/wp-json/wp/v2/types/page"}], "author": [{"href": "https://owid.cloud/wp-json/wp/v2/users/49", "embeddable": true}], "curies": [{"href": "https://api.w.org/{rel}", "name": "wp", "templated": true}], "replies": [{"href": "https://owid.cloud/wp-json/wp/v2/comments?post=56935", "embeddable": true}], "wp:term": [{"href": "https://owid.cloud/wp-json/wp/v2/categories?post=56935", "taxonomy": "category", "embeddable": true}, {"href": "https://owid.cloud/wp-json/wp/v2/tags?post=56935", "taxonomy": "post_tag", "embeddable": true}], "collection": [{"href": "https://owid.cloud/wp-json/wp/v2/pages"}], "wp:attachment": [{"href": "https://owid.cloud/wp-json/wp/v2/media?parent=56935"}], "version-history": [{"href": "https://owid.cloud/wp-json/wp/v2/pages/56935/revisions", "count": 13}], "wp:featuredmedia": [{"href": "https://owid.cloud/wp-json/wp/v2/media/57050", "embeddable": true}], "predecessor-version": [{"id": 57900, "href": "https://owid.cloud/wp-json/wp/v2/pages/56935/revisions/57900"}]}, "author": 49, "parent": 0, "status": "publish", "content": {"rendered": "\n\n<div class=\"wp-block-columns front-matter\">\n<div class=\"wp-block-column\">\n<div class=\"wp-container-65e6e28379b32 wp-block-group related-topics\">\n<p>This page is now maintained in Google Docs: <a href=\"htt… | |
| 1204 | 1204 | 56926 | Women's Rights | women-rights | page | publish | <!-- wp:paragraph --> <p>This page is now maintained in Google Docs: https://owid.cloud/admin/gdocs/195wtinOB2zsiGevmvUfAGPZv4NrG4jY_vpib49e5gt4/preview</p> <!-- /wp:paragraph --> |
{"id": "wp-56926", "slug": "women-rights", "content": {"toc": [], "body": [{"type": "text", "value": [{"text": "This page is now maintained in Google Docs: https://owid.cloud/admin/gdocs/195wtinOB2zsiGevmvUfAGPZv4NrG4jY_vpib49e5gt4/preview", "spanType": "span-simple-text"}], "parseErrors": []}], "type": "article", "title": "Women's Rights", "authors": ["Bastian Herre", "Pablo Arriagada", "Esteban Ortiz-Ospina", "Hannah Ritchie", "Joe Hasell", "Max Roser"], "excerpt": "How has the protection of women’s rights changed over time? How does it differ across countries? Explore global data and research on women’s rights.", "dateline": "May 12, 2023", "subtitle": "How has the protection of women’s rights changed over time? How does it differ across countries? Explore global data and research on women’s rights.", "sidebar-toc": false, "featured-image": "Womens-Rights.png"}, "createdAt": "2023-05-12T10:03:09.000Z", "published": false, "updatedAt": "2023-07-18T21:12:37.000Z", "revisionId": null, "publishedAt": "2023-05-12T09:03:25.000Z", "relatedCharts": [], "publicationContext": "listed"} | {"errors": [], "numBlocks": 1, "numErrors": 0, "wpTagCounts": {"paragraph": 1}, "htmlTagCounts": {"p": 1}} | 2023-05-12 09:03:25 | 2024-02-16 14:22:42 | ["Bastian Herre", "Pablo Arriagada", "Esteban Ortiz-Ospina", "Hannah Ritchie", "Joe Hasell"] | How has the protection of women’s rights changed over time? How does it differ across countries? Explore global data and research on women’s rights. | 2023-05-12 10:03:09 | 2023-07-18 21:12:37 | https://ourworldindata.org/wp-content/uploads/2023/05/Womens-Rights.png | {} | This page is now maintained in Google Docs: https://owid.cloud/admin/gdocs/195wtinOB2zsiGevmvUfAGPZv4NrG4jY_vpib49e5gt4/preview | {"id": 56926, "date": "2023-05-12T10:03:25", "guid": {"rendered": "https://owid.cloud/?page_id=56926"}, "link": "https://owid.cloud/women-rights", "meta": {"owid_publication_context_meta_field": [], "owid_key_performance_indicators_meta_field": {"raw": "Women's rights are much more protected than in the past, but are often a lot less protected than those of men.", "rendered": "<p>Women's rights are much more protected than in the past, but are often a lot less protected than those of men.</p>\n"}}, "slug": "women-rights", "tags": [], "type": "page", "title": {"rendered": "Women’s Rights"}, "_links": {"self": [{"href": "https://owid.cloud/wp-json/wp/v2/pages/56926"}], "about": [{"href": "https://owid.cloud/wp-json/wp/v2/types/page"}], "author": [{"href": "https://owid.cloud/wp-json/wp/v2/users/49", "embeddable": true}], "curies": [{"href": "https://api.w.org/{rel}", "name": "wp", "templated": true}], "replies": [{"href": "https://owid.cloud/wp-json/wp/v2/comments?post=56926", "embeddable": true}], "wp:term": [{"href": "https://owid.cloud/wp-json/wp/v2/categories?post=56926", "taxonomy": "category", "embeddable": true}, {"href": "https://owid.cloud/wp-json/wp/v2/tags?post=56926", "taxonomy": "post_tag", "embeddable": true}], "collection": [{"href": "https://owid.cloud/wp-json/wp/v2/pages"}], "wp:attachment": [{"href": "https://owid.cloud/wp-json/wp/v2/media?parent=56926"}], "version-history": [{"href": "https://owid.cloud/wp-json/wp/v2/pages/56926/revisions", "count": 22}], "wp:featuredmedia": [{"href": "https://owid.cloud/wp-json/wp/v2/media/57051", "embeddable": true}], "predecessor-version": [{"id": 57907, "href": "https://owid.cloud/wp-json/wp/v2/pages/56926/revisions/57907"}]}, "author": 49, "parent": 0, "status": "publish", "content": {"rendered": "\n<p>This page is now maintained in Google Docs: https://owid.cloud/admin/gdocs/195wtinOB2zsiGevmvUfAGPZv4NrG4jY_vpib49e5gt4/preview</p>\n", "protected": false}, "excerpt": {"rendered": "How has the protection of women’s rights changed over time? How does it … | |
| 1203 | 1203 | 56832 | Influenza | influenza | page | publish | <!-- wp:html -->
<!-- formatting-options toc:false bodyClassName:topic-page -->
<!-- /wp:html -->
<!-- wp:owid/sticky-nav -->
<!-- wp:navigation-link {"label":"Introduction","url":"#introduction","kind":"custom","isTopLevelLink":false} /-->
<!-- wp:navigation-link {"label":"Key Insights","url":"#key-insights","kind":"custom","isTopLevelLink":false} /-->
<!-- wp:navigation-link {"label":"Data Explorer","rel":"","url":"#explore-our-data-on-influenza","title":"","kind":"custom","isTopLevelLink":false} /-->
<!-- wp:navigation-link {"label":"Research \u0026amp; Writing","url":"#research-writing","kind":"custom","isTopLevelLink":false} /-->
<!-- wp:navigation-link {"label":"Charts","url":"#interactive-charts-on-influenza","kind":"custom","isTopLevelLink":false} /-->
<!-- wp:navigation-link {"label":"Endnotes","url":"#endnotes","kind":"custom","isTopLevelLink":false} /-->
<!-- wp:navigation-link {"label":"Cite This Work","url":"#citation","kind":"custom","isTopLevelLink":false} /-->
<!-- wp:navigation-link {"label":"Reuse This Work","url":"#licence","kind":"custom","isTopLevelLink":false} /-->
<!-- /wp:owid/sticky-nav -->
<!-- wp:owid/front-matter -->
<!-- wp:columns {"className":"front-matter"} -->
<div class="wp-block-columns front-matter"><!-- wp:column -->
<div class="wp-block-column" id="introduction"><!-- wp:paragraph -->
<p>Seasonal flu is a contagious illness caused by the influenza virus. It kills around 400,000 people from respiratory disease on average each year. In large pandemics, when new strains have evolved, the death toll has been much higher. </p>
<!-- /wp:paragraph -->
<!-- wp:paragraph -->
<p>Yet, data on the flu is limited. With better testing, countries could improve their response to flu epidemics. It could help to rapidly identify new strains, detect epidemics early, and design better-matched vaccines to target flu strains circulating in the population.</p>
<!-- /wp:paragraph -->
<!-- wp:paragraph -->
<p>This page therefore shows estimates of deaths during seasonal flu epidemics, … |
{"id": "wp-56832", "slug": "influenza", "content": {"toc": [], "body": [{"left": [{"type": "text", "value": [{"text": "Seasonal flu is a contagious illness caused by the influenza virus. It kills around 400,000 people from respiratory disease on average each year. In large pandemics, when new strains have evolved, the death toll has been much higher. ", "spanType": "span-simple-text"}], "parseErrors": []}, {"type": "text", "value": [{"text": "Yet, data on the flu is limited. With better testing, countries could improve their response to flu epidemics. It could help to rapidly identify new strains, detect epidemics early, and design better-matched vaccines to target flu strains circulating in the population.", "spanType": "span-simple-text"}], "parseErrors": []}, {"type": "text", "value": [{"text": "This page therefore shows estimates of deaths during seasonal flu epidemics, historical flu pandemics, patterns of flu seasons in different countries, and confirmed cases of flu and flu-like symptoms across the world.", "spanType": "span-simple-text"}], "parseErrors": []}, {"type": "text", "value": [{"text": "It also includes our Flu Explorer, a resource for epidemiologists, infectious disease researchers, and public health experts to monitor the global spread of the influenza virus.", "spanType": "span-simple-text"}], "parseErrors": []}], "type": "sticky-right", "right": [{"type": "text", "value": [{"text": "Related topics", "spanType": "span-simple-text"}], "parseErrors": []}, {"type": "list", "items": [{"type": "text", "value": [{"url": "https://ourworldindata.org/causes-of-death", "children": [{"text": "Causes of Death", "spanType": "span-simple-text"}], "spanType": "span-link"}], "parseErrors": []}, {"type": "text", "value": [{"url": "https://ourworldindata.org/vaccination", "children": [{"text": "Vaccination", "spanType": "span-simple-text"}], "spanType": "span-link"}], "parseErrors": []}, {"type": "text", "value": [{"url": "https://ourworldindata.org/coronavirus", "children": [{"text": "Covid-19", "spanType": "s… | {"errors": [{"name": "unexpected wp component tag", "details": "Found unhandled wp:comment tag navigation-link"}, {"name": "unexpected wp component tag", "details": "Found unhandled wp:comment tag navigation-link"}, {"name": "unexpected wp component tag", "details": "Found unhandled wp:comment tag navigation-link"}, {"name": "unexpected wp component tag", "details": "Found unhandled wp:comment tag navigation-link"}, {"name": "unexpected wp component tag", "details": "Found unhandled wp:comment tag navigation-link"}, {"name": "unexpected wp component tag", "details": "Found unhandled wp:comment tag navigation-link"}, {"name": "unexpected wp component tag", "details": "Found unhandled wp:comment tag navigation-link"}, {"name": "unexpected wp component tag", "details": "Found unhandled wp:comment tag navigation-link"}, {"name": "unexpected wp component tag", "details": "Found unhandled wp:comment tag owid/sticky-nav"}, {"name": "unexpected wp component tag", "details": "Found unhandled wp:comment tag list"}, {"name": "unexpected wp component tag", "details": "Found unhandled wp:comment tag group"}, {"name": "unexpected wp component tag", "details": "Found unhandled wp:comment tag owid/front-matter"}, {"name": "prominent link missing title", "details": "Prominent link is missing a title attribute"}, {"name": "unexpected wp component tag", "details": "Found unhandled wp:comment tag list"}, {"name": "unexpected wp component tag", "details": "Found unhandled wp:comment tag owid/technical-text"}, {"name": "unexpected wp component tag", "details": "Found unhandled wp:comment tag owid/key-insight"}, {"name": "unexpected wp component tag", "details": "Found unhandled wp:comment tag list"}, {"name": "unexpected wp component tag", "details": "Found unhandled wp:comment tag owid/technical-text"}, {"name": "unexpected wp component tag", "details": "Found unhandled wp:comment tag owid/key-insight"}, {"name": "prominent link missing title", "details": "Prominent link is missing a title attribute"}, {"name": "unexpected wp compone… | 2023-05-18 08:46:00 | 2024-03-05 09:19:03 | 16tVxsM1-wzwm_wpno-Y-M_IEInOCPJuWZqHfMLywNJc | ["Saloni Dattani", "Fiona Spooner", "Edouard Mathieu", "Hannah Ritchie", "Max Roser"] | Flu epidemics kill hundreds of thousands of people globally each year, but countries can respond and save lives with better data. | 2023-05-10 09:34:09 | 2023-06-14 20:17:51 | https://ourworldindata.org/wp-content/uploads/2023/05/flu-topic-page-thumbnail.png | {"toc": false, "bodyClassName": "topic-page"} | Seasonal flu is a contagious illness caused by the influenza virus. It kills around 400,000 people from respiratory disease on average each year. In large pandemics, when new strains have evolved, the death toll has been much higher. Yet, data on the flu is limited. With better testing, countries could improve their response to flu epidemics. It could help to rapidly identify new strains, detect epidemics early, and design better-matched vaccines to target flu strains circulating in the population. This page therefore shows estimates of deaths during seasonal flu epidemics, historical flu pandemics, patterns of flu seasons in different countries, and confirmed cases of flu and flu-like symptoms across the world. It also includes our Flu Explorer, a resource for epidemiologists, infectious disease researchers, and public health experts to monitor the global spread of the influenza virus. Related topics * [Causes of Death](https://ourworldindata.org/causes-of-death) * [Vaccination](https://ourworldindata.org/vaccination) * [Covid-19](https://ourworldindata.org/coronavirus) The flu is estimated to cause [400,000 respiratory deaths each year](https://ourworldindata.org/influenza-deaths) on average across the world. These deaths come from pneumonia and other respiratory symptoms caused by the flu.{ref}Paget J, Spreeuwenberg P, Charu V, Taylor RJ, Iuliano AD, Bresee J, Simonsen L, Viboud C; Global Seasonal Influenza-associated Mortality Collaborator Network and GLaMOR Collaborating Teams*. Global mortality associated with seasonal influenza epidemics: New burden estimates and predictors from the GLaMOR Project. J Glob Health. 2019 Dec;9(2):020421. doi: 10.7189/jogh.09.020421. [https://jogh.org/documents/issue201902/jogh-09-020421.pdf](https://jogh.org/documents/issue201902/jogh-09-020421.pdf) This shows the mean estimate of annual influenza mortality between 2002–2011, excluding the 2009 “Swine flu” pandemic influenza season. You can find estimated numbers for world regions in Table 2 of the paper. Rates for ot… | {"id": 56832, "date": "2023-05-18T09:46:00", "guid": {"rendered": "https://owid.cloud/?page_id=56832"}, "link": "https://owid.cloud/influenza", "meta": {"owid_publication_context_meta_field": [], "owid_key_performance_indicators_meta_field": []}, "slug": "influenza", "tags": [], "type": "page", "title": {"rendered": "Influenza"}, "_links": {"self": [{"href": "https://owid.cloud/wp-json/wp/v2/pages/56832"}], "about": [{"href": "https://owid.cloud/wp-json/wp/v2/types/page"}], "author": [{"href": "https://owid.cloud/wp-json/wp/v2/users/47", "embeddable": true}], "curies": [{"href": "https://api.w.org/{rel}", "name": "wp", "templated": true}], "replies": [{"href": "https://owid.cloud/wp-json/wp/v2/comments?post=56832", "embeddable": true}], "wp:term": [{"href": "https://owid.cloud/wp-json/wp/v2/categories?post=56832", "taxonomy": "category", "embeddable": true}, {"href": "https://owid.cloud/wp-json/wp/v2/tags?post=56832", "taxonomy": "post_tag", "embeddable": true}], "collection": [{"href": "https://owid.cloud/wp-json/wp/v2/pages"}], "wp:attachment": [{"href": "https://owid.cloud/wp-json/wp/v2/media?parent=56832"}], "version-history": [{"href": "https://owid.cloud/wp-json/wp/v2/pages/56832/revisions", "count": 28}], "wp:featuredmedia": [{"href": "https://owid.cloud/wp-json/wp/v2/media/56858", "embeddable": true}], "predecessor-version": [{"id": 57395, "href": "https://owid.cloud/wp-json/wp/v2/pages/56832/revisions/57395"}]}, "author": 47, "parent": 0, "status": "publish", "content": {"rendered": "\n<!-- formatting-options toc:false bodyClassName:topic-page -->\n\n\n\t<div class=\"sticky-nav-contents\">\n<li class=\" wp-block-navigation-item wp-block-navigation-link\"><a class=\"wp-block-navigation-item__content\" href=\"#introduction\"><span class=\"wp-block-navigation-item__label\">Introduction</span></a></li>\n\n<li class=\" wp-block-navigation-item wp-block-navigation-link\"><a class=\"wp-block-navigation-item__content\" href=\"#key-insights\"><span class=\"wp-block-navigation-item__label\">Key Insights</span></… |
| 1202 | 1202 | 56798 | How is food insecurity measured? | food-insecurity | post | publish | <!-- wp:columns -->
<div class="wp-block-columns"><!-- wp:column -->
<div class="wp-block-column"><!-- wp:paragraph -->
<p>Food insecurity <a href="https://www.fao.org/hunger/en/">is defined by</a> the Food and Agriculture Organization (FAO) of the United Nations as the “situation when people lack secure access to sufficient amounts of safe and nutritious food for normal growth and development and an active and healthy life.”</p>
<!-- /wp:paragraph -->
<!-- wp:paragraph -->
<p>The chart below shows the share of the population that is ‘severely food insecure'. Let’s look at what this means, and how this is measured.</p>
<!-- /wp:paragraph --></div>
<!-- /wp:column -->
<!-- wp:column -->
<div class="wp-block-column"><!-- wp:html -->
<iframe src="https://ourworldindata.org/grapher/share-of-population-with-severe-food-insecurity" loading="lazy" style="width: 100%; height: 600px; border: 0px none;"></iframe>
<!-- /wp:html --></div>
<!-- /wp:column --></div>
<!-- /wp:columns -->
<!-- wp:heading {"level":3} -->
<h3>What is food insecurity and how is it measured?</h3>
<!-- /wp:heading -->
<!-- wp:columns -->
<div class="wp-block-columns"><!-- wp:column -->
<div class="wp-block-column"><!-- wp:paragraph -->
<p>Food insecurity is one of the major causes of poor nutrition.</p>
<!-- /wp:paragraph -->
<!-- wp:paragraph -->
<p>Food insecurity can be caused by several factors: food might be physically unavailable in a particular country or region; it can be <a href="http://ourworldindata.org/food-prices">unaffordable</a> even if it is available to buy; or there might be an unequal distribution of food between household members.</p>
<!-- /wp:paragraph -->
<!-- wp:paragraph -->
<p>Food insecurity is measured by the FAO using its Food Insecurity Experience Scale (FIES) global reference scale.</p>
<!-- /wp:paragraph -->
<!-- wp:paragraph -->
<p>Food insecurity can be based on how having <em>enough</em> food (the quantity) or having inadequate <em>quality</em> and diversity of food. Someone might get enough food to meet their… |
{"id": "wp-56798", "slug": "food-insecurity", "content": {"toc": [], "body": [{"left": [{"type": "text", "value": [{"text": "Food insecurity ", "spanType": "span-simple-text"}, {"url": "https://www.fao.org/hunger/en/", "children": [{"text": "is defined by", "spanType": "span-simple-text"}], "spanType": "span-link"}, {"text": " the Food and Agriculture Organization (FAO) of the United Nations as the “situation when people lack secure access to sufficient amounts of safe and nutritious food for normal growth and development and an active and healthy life.”", "spanType": "span-simple-text"}], "parseErrors": []}, {"type": "text", "value": [{"text": "The chart below shows the share of the population that is ‘severely food insecure'. Let’s look at what this means, and how this is measured.", "spanType": "span-simple-text"}], "parseErrors": []}], "type": "sticky-right", "right": [{"url": "https://ourworldindata.org/grapher/share-of-population-with-severe-food-insecurity", "type": "chart", "parseErrors": []}], "parseErrors": []}, {"text": [{"text": "What is food insecurity and how is it measured?", "spanType": "span-simple-text"}], "type": "heading", "level": 2, "parseErrors": []}, {"left": [{"type": "text", "value": [{"text": "Food insecurity is one of the major causes of poor nutrition.", "spanType": "span-simple-text"}], "parseErrors": []}, {"type": "text", "value": [{"text": "Food insecurity can be caused by several factors: food might be physically unavailable in a particular country or region; it can be ", "spanType": "span-simple-text"}, {"url": "http://ourworldindata.org/food-prices", "children": [{"text": "unaffordable", "spanType": "span-simple-text"}], "spanType": "span-link"}, {"text": " even if it is available to buy; or there might be an unequal distribution of food between household members.", "spanType": "span-simple-text"}], "parseErrors": []}, {"type": "text", "value": [{"text": "Food insecurity is measured by the FAO using its Food Insecurity Experience Scale (FIES) global reference scale.", "spanType"… | {"errors": [{"name": "unexpected wp component tag", "details": "Found unhandled wp:comment tag image"}, {"name": "unhandled html tag found", "details": "Encountered the unhandled tag hr"}, {"name": "unexpected wp component tag", "details": "Found unhandled wp:comment tag separator"}, {"name": "unhandled html tag found", "details": "Encountered the unhandled tag hr"}, {"name": "unexpected wp component tag", "details": "Found unhandled wp:comment tag separator"}, {"name": "unexpected wp component tag", "details": "Found unhandled wp:comment tag list"}], "numBlocks": 10, "numErrors": 6, "wpTagCounts": {"html": 3, "list": 1, "image": 1, "column": 8, "columns": 4, "heading": 3, "paragraph": 22, "separator": 2, "owid/prominent-link": 1}, "htmlTagCounts": {"p": 22, "h3": 2, "h5": 1, "hr": 2, "ol": 1, "div": 12, "figure": 1, "iframe": 3}} | 2023-04-27 05:49:24 | 2024-03-10 13:33:48 | 1NYBMqLqqpb6M7HMFU6yiShVVsXUbD55J0omiuPCVy3A | ["Hannah Ritchie"] | Billions of people suffer from food insecurity. What does this it mean to be food insecure? | 2023-04-27 06:44:43 | 2023-07-10 16:29:09 | https://ourworldindata.org/wp-content/uploads/2023/03/Food-insecurity-01.png | {} | Food insecurity [is defined by](https://www.fao.org/hunger/en/) the Food and Agriculture Organization (FAO) of the United Nations as the “situation when people lack secure access to sufficient amounts of safe and nutritious food for normal growth and development and an active and healthy life.” The chart below shows the share of the population that is ‘severely food insecure'. Let’s look at what this means, and how this is measured. <Chart url="https://ourworldindata.org/grapher/share-of-population-with-severe-food-insecurity"/> ## What is food insecurity and how is it measured? Food insecurity is one of the major causes of poor nutrition. Food insecurity can be caused by several factors: food might be physically unavailable in a particular country or region; it can be [unaffordable](http://ourworldindata.org/food-prices) even if it is available to buy; or there might be an unequal distribution of food between household members. Food insecurity is measured by the FAO using its Food Insecurity Experience Scale (FIES) global reference scale. Food insecurity can be based on how having _enough_ food (the quantity) or having inadequate _quality_ and diversity of food. Someone might get enough food to meet their energy requirements, but they might rely on only a few basic foods (such as cereals) and have a diet with very little diversity. The FIES measures the share of the population that has experienced food insecurity at moderate or severe levels during the period of measurement. Data is collected at the household level using a food security questionnaire. This survey asks households about a number of conditions that someone with food insecurity would typically experience. It’s based on eight questions (the [full list](https://unstats.un.org/sdgs/metadata/files/Metadata-02-01-02.pdf) is given at the end of this article), such as: _“During the last 12 months, was there a time when you (or any other adult in the household) were worried you would not have enough food to eat because of a lack of money or other… | {"id": 56798, "date": "2023-04-27T06:49:24", "guid": {"rendered": "https://owid.cloud/?p=56798"}, "link": "https://owid.cloud/food-insecurity", "meta": {"owid_publication_context_meta_field": {"latest": true, "homepage": true, "immediate_newsletter": true}}, "slug": "food-insecurity", "tags": [], "type": "post", "title": {"rendered": "How is food insecurity measured?"}, "_links": {"self": [{"href": "https://owid.cloud/wp-json/wp/v2/posts/56798"}], "about": [{"href": "https://owid.cloud/wp-json/wp/v2/types/post"}], "author": [{"href": "https://owid.cloud/wp-json/wp/v2/users/17", "embeddable": true}], "curies": [{"href": "https://api.w.org/{rel}", "name": "wp", "templated": true}], "replies": [{"href": "https://owid.cloud/wp-json/wp/v2/comments?post=56798", "embeddable": true}], "wp:term": [{"href": "https://owid.cloud/wp-json/wp/v2/categories?post=56798", "taxonomy": "category", "embeddable": true}, {"href": "https://owid.cloud/wp-json/wp/v2/tags?post=56798", "taxonomy": "post_tag", "embeddable": true}], "collection": [{"href": "https://owid.cloud/wp-json/wp/v2/posts"}], "wp:attachment": [{"href": "https://owid.cloud/wp-json/wp/v2/media?parent=56798"}], "version-history": [{"href": "https://owid.cloud/wp-json/wp/v2/posts/56798/revisions", "count": 5}], "wp:featuredmedia": [{"href": "https://owid.cloud/wp-json/wp/v2/media/56336", "embeddable": true}], "predecessor-version": [{"id": 57629, "href": "https://owid.cloud/wp-json/wp/v2/posts/56798/revisions/57629"}]}, "author": 17, "format": "standard", "status": "publish", "sticky": false, "content": {"rendered": "\n<div class=\"wp-block-columns\">\n<div class=\"wp-block-column\">\n<p>Food insecurity <a href=\"https://www.fao.org/hunger/en/\">is defined by</a> the Food and Agriculture Organization (FAO) of the United Nations as the “situation when people lack secure access to sufficient amounts of safe and nutritious food for normal growth and development and an active and healthy life.”</p>\n\n\n\n<p>The chart below shows the share of the population that is ‘severely f… |
| 1201 | 1201 | 56776 | We published a major overhaul of our work on Technological Change | tech-change-redesign | post | publish | {"id": "wp-56776", "slug": "tech-change-redesign", "content": {"toc": [], "body": [], "type": "article", "title": "We published a major overhaul of our work on Technological Change", "authors": ["Hannah Ritchie", "Edouard Mathieu", "Max Roser"], "excerpt": "Explore our updated charts, data, and writing on Technological Change across the world.", "dateline": "April 26, 2023", "subtitle": "Explore our updated charts, data, and writing on Technological Change across the world.", "sidebar-toc": false, "featured-image": "Technological-Change.png"}, "createdAt": "2023-04-26T10:32:55.000Z", "published": false, "updatedAt": "2023-04-26T09:34:41.000Z", "revisionId": null, "publishedAt": "2023-04-26T09:32:55.000Z", "relatedCharts": [], "publicationContext": "listed"} | {"errors": [], "numBlocks": 0, "numErrors": 0, "wpTagCounts": {}, "htmlTagCounts": {}} | 2023-04-26 09:32:55 | 2024-02-16 14:22:55 | ["Hannah Ritchie", "Edouard Mathieu", "Max Roser"] | Explore our updated charts, data, and writing on Technological Change across the world. | 2023-04-26 10:32:55 | 2023-04-26 09:34:41 | https://ourworldindata.org/wp-content/uploads/2023/03/Technological-Change.png | {} | {"id": 56776, "date": "2023-04-26T10:32:55", "guid": {"rendered": "https://owid.cloud/?p=56776"}, "link": "https://owid.cloud/tech-change-redesign", "meta": {"owid_publication_context_meta_field": {"latest": true, "homepage": true, "immediate_newsletter": true}}, "slug": "tech-change-redesign", "tags": [], "type": "post", "title": {"rendered": "We published a major overhaul of our work on Technological Change"}, "_links": {"self": [{"href": "https://owid.cloud/wp-json/wp/v2/posts/56776"}], "about": [{"href": "https://owid.cloud/wp-json/wp/v2/types/post"}], "author": [{"href": "https://owid.cloud/wp-json/wp/v2/users/17", "embeddable": true}], "curies": [{"href": "https://api.w.org/{rel}", "name": "wp", "templated": true}], "replies": [{"href": "https://owid.cloud/wp-json/wp/v2/comments?post=56776", "embeddable": true}], "wp:term": [{"href": "https://owid.cloud/wp-json/wp/v2/categories?post=56776", "taxonomy": "category", "embeddable": true}, {"href": "https://owid.cloud/wp-json/wp/v2/tags?post=56776", "taxonomy": "post_tag", "embeddable": true}], "collection": [{"href": "https://owid.cloud/wp-json/wp/v2/posts"}], "wp:attachment": [{"href": "https://owid.cloud/wp-json/wp/v2/media?parent=56776"}], "version-history": [{"href": "https://owid.cloud/wp-json/wp/v2/posts/56776/revisions", "count": 2}], "wp:featuredmedia": [{"href": "https://owid.cloud/wp-json/wp/v2/media/56441", "embeddable": true}], "predecessor-version": [{"id": 56779, "href": "https://owid.cloud/wp-json/wp/v2/posts/56776/revisions/56779"}]}, "author": 17, "format": "standard", "status": "publish", "sticky": false, "content": {"rendered": "", "protected": false}, "excerpt": {"rendered": "Explore our updated charts, data, and writing on Technological Change across the world.", "protected": false}, "date_gmt": "2023-04-26T09:32:55", "modified": "2023-04-26T10:34:41", "template": "", "categories": [1], "ping_status": "closed", "authors_name": ["Hannah Ritchie", "Edouard Mathieu", "Max Roser"], "modified_gmt": "2023-04-26T09:34:41", "comment_status": "close… | |||
| 1200 | 1200 | 56742 | Learning curves: What does it mean for a technology to follow Wright’s Law? | learning-curve | post | publish | <!-- wp:html -->
<div class="blog-info">
<p>Our World in Data presents the data and research to make progress against the world’s largest problems.<br>This article draws on data and research discussed in our entry on <strong><a href="https://ourworldindata.org/technological-change" target="_blank" rel="noopener">Technological Change</a></strong>.</p>
</div>
<!-- /wp:html -->
<!-- wp:paragraph -->
<p>Technologies that follow Wright’s Law get cheaper at a consistent rate, as the cumulative production of that technology increases. </p>
<!-- /wp:paragraph -->
<!-- wp:paragraph -->
<p>The best way to explain what this means is to look at a concrete example.</p>
<!-- /wp:paragraph -->
<!-- wp:heading {"level":4} -->
<h4>Solar technology: an example of a technology that follows Wright’s Law</h4>
<!-- /wp:heading -->
<!-- wp:paragraph -->
<p>The time series in the chart shows the deployment of solar panels on the horizontal axis and the price of solar panels on the vertical axis. The orange line that describes the relationship between these two metrics over time is called the <em>learning curve</em> of that technology. </p>
<!-- /wp:paragraph -->
<!-- wp:paragraph -->
<p>As the cumulative installed capacity increased, the price of solar <em>declined</em> <em>exponentially</em>. Solar technology is a prime example. For more than four decades, the price of solar panels declined by 20% with each doubling of global cumulative capacity.</p>
<!-- /wp:paragraph -->
<!-- wp:paragraph -->
<p>The fact that both metrics changed exponentially can be nicely seen in this chart because both axes are logarithmic. On a logarithmic axis, a measure that declines exponentially <a href="https://blog.datawrapper.de/weeklychart-logscale/">follows a straight line</a>. </p>
<!-- /wp:paragraph -->
<!-- wp:paragraph -->
<p>That more production leads to falling prices is not surprising – such ‘economies of scale’ are found in the production of many goods. If you are already making one pizza, making a second one isn’t that much… |
{"id": "wp-56742", "slug": "learning-curve", "content": {"toc": [], "body": [{"type": "text", "value": [{"text": "Our World in Data presents the data and research to make progress against the world’s largest problems.", "spanType": "span-simple-text"}, {"spanType": "span-newline"}, {"text": "This article draws on data and research discussed in our entry on ", "spanType": "span-simple-text"}, {"children": [{"url": "https://ourworldindata.org/technological-change", "children": [{"text": "Technological Change", "spanType": "span-simple-text"}], "spanType": "span-link"}], "spanType": "span-bold"}, {"text": ".", "spanType": "span-simple-text"}], "parseErrors": []}, {"type": "text", "value": [{"text": "Technologies that follow Wright’s Law get cheaper at a consistent rate, as the cumulative production of that technology increases. ", "spanType": "span-simple-text"}], "parseErrors": []}, {"type": "text", "value": [{"text": "The best way to explain what this means is to look at a concrete example.", "spanType": "span-simple-text"}], "parseErrors": []}, {"text": [{"text": "Solar technology: an example of a technology that follows Wright’s Law", "spanType": "span-simple-text"}], "type": "heading", "level": 2, "parseErrors": []}, {"type": "text", "value": [{"text": "The time series in the chart shows the deployment of solar panels on the horizontal axis and the price of solar panels on the vertical axis. The orange line that describes the relationship between these two metrics over time is called the ", "spanType": "span-simple-text"}, {"children": [{"text": "learning curve", "spanType": "span-simple-text"}], "spanType": "span-italic"}, {"text": " of that technology. ", "spanType": "span-simple-text"}], "parseErrors": []}, {"type": "text", "value": [{"text": "As the cumulative installed capacity increased, the price of solar ", "spanType": "span-simple-text"}, {"children": [{"text": "declined", "spanType": "span-simple-text"}], "spanType": "span-italic"}, {"children": [{"text": "exponentially", "spanType": "span-simple-text… | {"errors": [{"name": "unexpected wp component tag", "details": "Found unhandled wp:comment tag image"}], "numBlocks": 47, "numErrors": 1, "wpTagCounts": {"html": 1, "image": 1, "heading": 5, "paragraph": 41}, "htmlTagCounts": {"p": 42, "h4": 5, "div": 1, "figure": 1}} | 2023-04-18 00:57:56 | 2024-02-16 14:22:55 | 1THmmJVzdsf_Bl2xyf9xlYG4YZBamhvhD7SrlEmzOKlU | ["Max Roser"] | Technologies that follow Wright’s Law get cheaper at a consistent rate, as the cumulative production of that technology increases. | 2023-04-18 01:57:26 | 2023-07-10 16:24:50 | https://ourworldindata.org/wp-content/uploads/2023/04/Screenshot-2023-04-17-at-20.57.11.png | {} | Our World in Data presents the data and research to make progress against the world’s largest problems. This article draws on data and research discussed in our entry on **[Technological Change](https://ourworldindata.org/technological-change)**. Technologies that follow Wright’s Law get cheaper at a consistent rate, as the cumulative production of that technology increases. The best way to explain what this means is to look at a concrete example. ## Solar technology: an example of a technology that follows Wright’s Law The time series in the chart shows the deployment of solar panels on the horizontal axis and the price of solar panels on the vertical axis. The orange line that describes the relationship between these two metrics over time is called the _learning curve_ of that technology. As the cumulative installed capacity increased, the price of solar _declined__exponentially_. Solar technology is a prime example. For more than four decades, the price of solar panels declined by 20% with each doubling of global cumulative capacity. The fact that both metrics changed exponentially can be nicely seen in this chart because both axes are logarithmic. On a logarithmic axis, a measure that declines exponentially [follows a straight line](https://blog.datawrapper.de/weeklychart-logscale/). That more production leads to falling prices is not surprising – such ‘economies of scale’ are found in the production of many goods. If you are already making one pizza, making a second one isn’t that much extra work. What is exceptional about technologies that follow a learning curve is that this effect persists, and _the rate at which the price declines stays roughly constant_. This is what it means for a technology to follow Wright’s Law. <Image filename="solar-pv-prices-vs-cumulative-capacity.png" alt=""/> ## The relationship between the laws of Gordon Moore and Theodore Paul Wright Solar power is not the only technology where we see trends of exponential change. The most famous case of exponential technologi… | {"id": 56742, "date": "2023-04-18T01:57:56", "guid": {"rendered": "https://owid.cloud/?p=56742"}, "link": "https://owid.cloud/learning-curve", "meta": {"owid_publication_context_meta_field": {"latest": true, "homepage": true, "immediate_newsletter": true}}, "slug": "learning-curve", "tags": [], "type": "post", "title": {"rendered": "Learning curves: What does it mean for a technology to follow Wright’s Law?"}, "_links": {"self": [{"href": "https://owid.cloud/wp-json/wp/v2/posts/56742"}], "about": [{"href": "https://owid.cloud/wp-json/wp/v2/types/post"}], "author": [{"href": "https://owid.cloud/wp-json/wp/v2/users/2", "embeddable": true}], "curies": [{"href": "https://api.w.org/{rel}", "name": "wp", "templated": true}], "replies": [{"href": "https://owid.cloud/wp-json/wp/v2/comments?post=56742", "embeddable": true}], "wp:term": [{"href": "https://owid.cloud/wp-json/wp/v2/categories?post=56742", "taxonomy": "category", "embeddable": true}, {"href": "https://owid.cloud/wp-json/wp/v2/tags?post=56742", "taxonomy": "post_tag", "embeddable": true}], "collection": [{"href": "https://owid.cloud/wp-json/wp/v2/posts"}], "wp:attachment": [{"href": "https://owid.cloud/wp-json/wp/v2/media?parent=56742"}], "version-history": [{"href": "https://owid.cloud/wp-json/wp/v2/posts/56742/revisions", "count": 4}], "wp:featuredmedia": [{"href": "https://owid.cloud/wp-json/wp/v2/media/56744", "embeddable": true}], "predecessor-version": [{"id": 56764, "href": "https://owid.cloud/wp-json/wp/v2/posts/56742/revisions/56764"}]}, "author": 2, "format": "standard", "status": "publish", "sticky": false, "content": {"rendered": "\n<div class=\"blog-info\">\n<p>Our World in Data presents the data and research to make progress against the world’s largest problems.<br>This article draws on data and research discussed in our entry on <strong><a href=\"https://ourworldindata.org/technological-change\" target=\"_blank\" rel=\"noopener\">Technological Change</a></strong>.</p>\n</div>\n\n\n\n<p>Technologies that follow Wright’s Law get cheaper at a consi… |
| 1199 | 1199 | 56732 | Flu Explorer - Introductory text | flu-explorer-introductory-text | wp_block | publish | <!-- wp:heading --> <h2>Why we provide this Influenza Data Explorer</h2> <!-- /wp:heading --> <!-- wp:paragraph --> <p><strong>With this Flu Explorer, we aim to provide a helpful resource for epidemiologists, infectious disease researchers, and public health experts to understand the global spread of the influenza virus.</strong></p> <!-- /wp:paragraph --> <!-- wp:paragraph --> <p>While influenza is not always at the forefront of the public's mind, it is a significant cause of death globally — it causes <a href="https://pubmed.ncbi.nlm.nih.gov/31673337/">400,000 respiratory deaths</a> each year on average.</p> <!-- /wp:paragraph --> <!-- wp:paragraph --> <p>Additionally, it is considered <a href="https://doi.org/10.1038/s12276-021-00603-0">one of the leading candidates</a> for a future pandemic. To detect these risks early, the world must closely monitor the situation. Accessible data must be available for those who can help understand and manage the potential threats.</p> <!-- /wp:paragraph --> <!-- wp:paragraph --> <p>This Flu Data Explorer differs from our widely-used infectious diseases projects, such as the <a href="https://ourworldindata.org/explorers/coronavirus-data-explorer">COVID-19 Explorer</a> and the <a href="https://ourworldindata.org/explorers/monkeypox">Mpox Explorer</a>. These tools are designed for a broad audience. Unfortunately, flu data is incomplete in many ways, making it harder to communicate. <strong>This tool is therefore designed for users with pre-existing knowledge to navigate effectively the complex data published by the World Health Organization.</strong></p> <!-- /wp:paragraph --> <!-- wp:paragraph --> <p>The explorer also highlights the significant gaps in influenza data. It is an important reminder of the need to improve data collection and reporting.</p> <!-- /wp:paragraph --> <!-- wp:paragraph --> <p>Before navigating this Explorer, we recommend reading the <a href="https://ourworldindata.org/influenza#key-insights-on-influenza">key insights</a> on our Influenza page; the… |
{"id": "wp-56732", "slug": "flu-explorer-introductory-text", "content": {"toc": [], "body": [{"text": [{"text": "Why we provide this Influenza Data Explorer", "spanType": "span-simple-text"}], "type": "heading", "level": 2, "parseErrors": []}, {"type": "text", "value": [{"children": [{"text": "With this Flu Explorer, we aim to provide a helpful resource for epidemiologists, infectious disease researchers, and public health experts to understand the global spread of the influenza virus.", "spanType": "span-simple-text"}], "spanType": "span-bold"}], "parseErrors": []}, {"type": "text", "value": [{"text": "While influenza is not always at the forefront of the public's mind, it is a significant cause of death globally — it causes ", "spanType": "span-simple-text"}, {"url": "https://pubmed.ncbi.nlm.nih.gov/31673337/", "children": [{"text": "400,000 respiratory deaths", "spanType": "span-simple-text"}], "spanType": "span-link"}, {"text": " each year on average.", "spanType": "span-simple-text"}], "parseErrors": []}, {"type": "text", "value": [{"text": "Additionally, it is considered ", "spanType": "span-simple-text"}, {"url": "https://doi.org/10.1038/s12276-021-00603-0", "children": [{"text": "one of the leading candidates", "spanType": "span-simple-text"}], "spanType": "span-link"}, {"text": " for a future pandemic. To detect these risks early, the world must closely monitor the situation. Accessible data must be available for those who can help understand and manage the potential threats.", "spanType": "span-simple-text"}], "parseErrors": []}, {"type": "text", "value": [{"text": "This Flu Data Explorer differs from our widely-used infectious diseases projects, such as the ", "spanType": "span-simple-text"}, {"url": "https://ourworldindata.org/explorers/coronavirus-data-explorer", "children": [{"text": "COVID-19 Explorer", "spanType": "span-simple-text"}], "spanType": "span-link"}, {"text": " and the ", "spanType": "span-simple-text"}, {"url": "https://ourworldindata.org/explorers/monkeypox", "children": [{"text": "Mp… | {"errors": [], "numBlocks": 7, "numErrors": 0, "wpTagCounts": {"heading": 1, "paragraph": 6}, "htmlTagCounts": {"p": 6, "h2": 1}} | 2023-04-13 13:59:19 | 2024-02-16 14:23:03 | [null] | 2023-04-13 14:59:19 | 2023-04-26 12:58:26 | {} | ## Why we provide this Influenza Data Explorer **With this Flu Explorer, we aim to provide a helpful resource for epidemiologists, infectious disease researchers, and public health experts to understand the global spread of the influenza virus.** While influenza is not always at the forefront of the public's mind, it is a significant cause of death globally — it causes [400,000 respiratory deaths](https://pubmed.ncbi.nlm.nih.gov/31673337/) each year on average. Additionally, it is considered [one of the leading candidates](https://doi.org/10.1038/s12276-021-00603-0) for a future pandemic. To detect these risks early, the world must closely monitor the situation. Accessible data must be available for those who can help understand and manage the potential threats. This Flu Data Explorer differs from our widely-used infectious diseases projects, such as the [COVID-19 Explorer](https://ourworldindata.org/explorers/coronavirus-data-explorer) and the [Mpox Explorer](https://ourworldindata.org/explorers/monkeypox). These tools are designed for a broad audience. Unfortunately, flu data is incomplete in many ways, making it harder to communicate. **This tool is therefore designed for users with pre-existing knowledge to navigate effectively the complex data published by the World Health Organization.** The explorer also highlights the significant gaps in influenza data. It is an important reminder of the need to improve data collection and reporting. Before navigating this Explorer, we recommend reading the [key insights](https://ourworldindata.org/influenza#key-insights-on-influenza) on our Influenza page; they provide more detail on how to interpret these metrics meaningfully. | {"data": {"wpBlock": {"content": "\n<h2>Why we provide this Influenza Data Explorer</h2>\n\n\n\n<p><strong>With this Flu Explorer, we aim to provide a helpful resource for epidemiologists, infectious disease researchers, and public health experts to understand the global spread of the influenza virus.</strong></p>\n\n\n\n<p>While influenza is not always at the forefront of the public’s mind, it is a significant cause of death globally — it causes <a href=\"https://pubmed.ncbi.nlm.nih.gov/31673337/\">400,000 respiratory deaths</a> each year on average.</p>\n\n\n\n<p>Additionally, it is considered <a href=\"https://doi.org/10.1038/s12276-021-00603-0\">one of the leading candidates</a> for a future pandemic. To detect these risks early, the world must closely monitor the situation. Accessible data must be available for those who can help understand and manage the potential threats.</p>\n\n\n\n<p>This Flu Data Explorer differs from our widely-used infectious diseases projects, such as the <a href=\"https://ourworldindata.org/explorers/coronavirus-data-explorer\">COVID-19 Explorer</a> and the <a href=\"https://ourworldindata.org/explorers/monkeypox\">Mpox Explorer</a>. These tools are designed for a broad audience. Unfortunately, flu data is incomplete in many ways, making it harder to communicate. <strong>This tool is therefore designed for users with pre-existing knowledge to navigate effectively the complex data published by the World Health Organization.</strong></p>\n\n\n\n<p>The explorer also highlights the significant gaps in influenza data. It is an important reminder of the need to improve data collection and reporting.</p>\n\n\n\n<p>Before navigating this Explorer, we recommend reading the <a href=\"https://ourworldindata.org/influenza#key-insights-on-influenza\">key insights</a> on our Influenza page; they provide more detail on how to interpret these metrics meaningfully.</p>\n"}}, "extensions": {"debug": [{"type": "DEBUG_LOGS_INACTIVE", "message": "GraphQL Debug logging is not active. To see debug l… | |||
| 1198 | 1198 | 56724 | We published a redesign of our work on the Internet | overhaul-internet | post | publish | {"id": "wp-56724", "slug": "overhaul-internet", "content": {"toc": [], "body": [], "type": "article", "title": "We published a redesign of our work on the Internet", "authors": ["Hannah Ritchie", "Edouard Mathieu"], "excerpt": "Explore our updated design, charts, and writing on global data on the Internet.", "dateline": "April 13, 2023", "subtitle": "Explore our updated design, charts, and writing on global data on the Internet.", "sidebar-toc": false, "featured-image": "Internet.png"}, "createdAt": "2023-04-13T09:13:24.000Z", "published": false, "updatedAt": "2023-04-26T09:31:55.000Z", "revisionId": null, "publishedAt": "2023-04-13T08:13:24.000Z", "relatedCharts": [], "publicationContext": "listed"} | {"errors": [], "numBlocks": 0, "numErrors": 0, "wpTagCounts": {}, "htmlTagCounts": {}} | 2023-04-13 08:13:24 | 2024-02-16 14:22:55 | ["Hannah Ritchie", "Edouard Mathieu"] | Explore our updated design, charts, and writing on global data on the Internet. | 2023-04-13 09:13:24 | 2023-04-26 09:31:55 | https://ourworldindata.org/wp-content/uploads/2023/04/Internet.png | {} | {"id": 56724, "date": "2023-04-13T09:13:24", "guid": {"rendered": "https://owid.cloud/?p=56724"}, "link": "https://owid.cloud/overhaul-internet", "meta": {"owid_publication_context_meta_field": {"latest": true, "homepage": true, "immediate_newsletter": true}}, "slug": "overhaul-internet", "tags": [], "type": "post", "title": {"rendered": "We published a redesign of our work on the Internet"}, "_links": {"self": [{"href": "https://owid.cloud/wp-json/wp/v2/posts/56724"}], "about": [{"href": "https://owid.cloud/wp-json/wp/v2/types/post"}], "author": [{"href": "https://owid.cloud/wp-json/wp/v2/users/17", "embeddable": true}], "curies": [{"href": "https://api.w.org/{rel}", "name": "wp", "templated": true}], "replies": [{"href": "https://owid.cloud/wp-json/wp/v2/comments?post=56724", "embeddable": true}], "wp:term": [{"href": "https://owid.cloud/wp-json/wp/v2/categories?post=56724", "taxonomy": "category", "embeddable": true}, {"href": "https://owid.cloud/wp-json/wp/v2/tags?post=56724", "taxonomy": "post_tag", "embeddable": true}], "collection": [{"href": "https://owid.cloud/wp-json/wp/v2/posts"}], "wp:attachment": [{"href": "https://owid.cloud/wp-json/wp/v2/media?parent=56724"}], "version-history": [{"href": "https://owid.cloud/wp-json/wp/v2/posts/56724/revisions", "count": 4}], "wp:featuredmedia": [{"href": "https://owid.cloud/wp-json/wp/v2/media/56553", "embeddable": true}], "predecessor-version": [{"id": 56775, "href": "https://owid.cloud/wp-json/wp/v2/posts/56724/revisions/56775"}]}, "author": 17, "format": "standard", "status": "publish", "sticky": false, "content": {"rendered": "", "protected": false}, "excerpt": {"rendered": "Explore our updated design, charts, and writing on global data on the Internet.", "protected": false}, "date_gmt": "2023-04-13T08:13:24", "modified": "2023-04-26T10:31:55", "template": "", "categories": [1], "ping_status": "closed", "authors_name": ["Hannah Ritchie", "Edouard Mathieu"], "modified_gmt": "2023-04-26T09:31:55", "comment_status": "closed", "featured_media": 56553, "featured_me… | |||
| 1197 | 1197 | 56663 | Population Growth | population-growth | page | publish | <!-- wp:html -->
<!-- formatting-options toc:false bodyClassName:topic-page -->
<!-- /wp:html -->
<!-- wp:owid/sticky-nav -->
<!-- wp:navigation-link {"label":"Introduction","url":"#introduction","kind":"custom","isTopLevelLink":false} /-->
<!-- wp:navigation-link {"label":"Key Insights","url":"#key-insights","kind":"custom","isTopLevelLink":false} /-->
<!-- wp:navigation-link {"label":"Data Explorer","rel":"","url":"#explore-data-poverty","title":"","kind":"custom","isTopLevelLink":false} /-->
<!-- wp:navigation-link {"label":"Research \u0026amp; Writing","url":"#research-writing","kind":"custom","isTopLevelLink":false} /-->
<!-- wp:navigation-link {"label":"Charts","url":"#interactive-charts-on-population-growth","kind":"custom","isTopLevelLink":false} /-->
<!-- wp:navigation-link {"label":"Endnotes","url":"#endnotes","kind":"custom","isTopLevelLink":false} /-->
<!-- wp:navigation-link {"label":"Cite This Work","url":"#citation","kind":"custom","isTopLevelLink":false} /-->
<!-- wp:navigation-link {"label":"Reuse This Work","url":"#licence","kind":"custom","isTopLevelLink":false} /-->
<!-- /wp:owid/sticky-nav -->
<!-- wp:owid/front-matter -->
<!-- wp:columns {"className":"front-matter"} -->
<div class="wp-block-columns front-matter"><!-- wp:column -->
<div class="wp-block-column" id="introduction"><!-- wp:paragraph -->
<p>Population growth is one of the most important topics we cover at <em>Our World in Data</em>.</p>
<!-- /wp:paragraph -->
<!-- wp:paragraph -->
<p>For most of human history, the global population was<em> </em>a tiny fraction of what it is today. Over the last few centuries, the human population has gone through an extraordinary change. In 1800, there were one billion people. Today there are more than 8 billion of us.</p>
<!-- /wp:paragraph -->
<!-- wp:paragraph -->
<p>But after a period of very fast population growth, demographers expect the world population to peak by the end of this century.</p>
<!-- /wp:paragraph -->
<!-- wp:paragraph -->
<p>On this page, you will find all of our … |
{"id": "wp-56663", "slug": "population-growth", "content": {"toc": [], "body": [{"left": [{"type": "text", "value": [{"text": "Population growth is one of the most important topics we cover at ", "spanType": "span-simple-text"}, {"children": [{"text": "Our World in Data", "spanType": "span-simple-text"}], "spanType": "span-italic"}, {"text": ".", "spanType": "span-simple-text"}], "parseErrors": []}, {"type": "text", "value": [{"text": "For most of human history, the global population was", "spanType": "span-simple-text"}, {"children": [{"text": " ", "spanType": "span-simple-text"}], "spanType": "span-italic"}, {"text": "a tiny fraction of what it is today. Over the last few centuries, the human population has gone through an extraordinary change. In 1800, there were one billion people. Today there are more than 8 billion of us.", "spanType": "span-simple-text"}], "parseErrors": []}, {"type": "text", "value": [{"text": "But after a period of very fast population growth, demographers expect the world population to peak by the end of this century.", "spanType": "span-simple-text"}], "parseErrors": []}, {"type": "text", "value": [{"text": "On this page, you will find all of our data, charts, and writing on changes in population growth. This includes how populations are distributed worldwide, how this has changed, and what demographers expect for the future.", "spanType": "span-simple-text"}], "parseErrors": []}], "type": "sticky-right", "right": [{"type": "text", "value": [{"text": "Related topics", "spanType": "span-simple-text"}], "parseErrors": []}, {"type": "list", "items": [{"type": "text", "value": [{"url": "https://ourworldindata.org/child-mortality", "children": [{"text": "Child Mortality", "spanType": "span-simple-text"}], "spanType": "span-link"}], "parseErrors": []}, {"type": "text", "value": [{"url": "https://ourworldindata.org/fertility-rate", "children": [{"text": "Fertility Rate", "spanType": "span-simple-text"}], "spanType": "span-link"}], "parseErrors": []}, {"type": "text", "value": [{"url": "https:… | {"errors": [{"name": "unexpected wp component tag", "details": "Found unhandled wp:comment tag navigation-link"}, {"name": "unexpected wp component tag", "details": "Found unhandled wp:comment tag navigation-link"}, {"name": "unexpected wp component tag", "details": "Found unhandled wp:comment tag navigation-link"}, {"name": "unexpected wp component tag", "details": "Found unhandled wp:comment tag navigation-link"}, {"name": "unexpected wp component tag", "details": "Found unhandled wp:comment tag navigation-link"}, {"name": "unexpected wp component tag", "details": "Found unhandled wp:comment tag navigation-link"}, {"name": "unexpected wp component tag", "details": "Found unhandled wp:comment tag navigation-link"}, {"name": "unexpected wp component tag", "details": "Found unhandled wp:comment tag navigation-link"}, {"name": "unexpected wp component tag", "details": "Found unhandled wp:comment tag owid/sticky-nav"}, {"name": "unexpected wp component tag", "details": "Found unhandled wp:comment tag list"}, {"name": "unexpected wp component tag", "details": "Found unhandled wp:comment tag group"}, {"name": "unexpected wp component tag", "details": "Found unhandled wp:comment tag owid/front-matter"}, {"name": "unexpected wp component tag", "details": "Found unhandled wp:comment tag list"}, {"name": "unexpected wp component tag", "details": "Found unhandled wp:comment tag owid/technical-text"}, {"name": "unexpected wp component tag", "details": "Found unhandled wp:comment tag image"}, {"name": "unexpected wp component tag", "details": "Found unhandled wp:comment tag owid/key-insight"}, {"name": "unexpected wp component tag", "details": "Found unhandled wp:comment tag list"}, {"name": "unexpected wp component tag", "details": "Found unhandled wp:comment tag owid/technical-text"}, {"name": "unexpected wp component tag", "details": "Found unhandled wp:comment tag image"}, {"name": "unexpected wp component tag", "details": "Found unhandled wp:comment tag owid/key-insight"}, {"name": "exepcted a single plain text element,… | 2023-07-11 07:00:00 | 2024-06-05 22:03:10 | 1q5NlayNjhqRCzAPcwgPdcJ_1X2bAS8CBEjeZqOCXQUI | ["Hannah Ritchie", "Lucas Rodés-Guirao", "Edouard Mathieu", "Marcel Gerber", "Esteban Ortiz-Ospina", "Joe Hasell", "Max Roser"] | Explore global and country data on population growth, demography, and how this is changing. | 2023-06-27 08:50:02 | 2023-11-09 17:51:54 | https://ourworldindata.org/wp-content/uploads/2023/04/World-Population-Growth.png | {"toc": false, "bodyClassName": "topic-page"} | Population growth is one of the most important topics we cover at _Our World in Data_. For most of human history, the global population was_ _a tiny fraction of what it is today. Over the last few centuries, the human population has gone through an extraordinary change. In 1800, there were one billion people. Today there are more than 8 billion of us. But after a period of very fast population growth, demographers expect the world population to peak by the end of this century. On this page, you will find all of our data, charts, and writing on changes in population growth. This includes how populations are distributed worldwide, how this has changed, and what demographers expect for the future. Related topics * [Child Mortality](https://ourworldindata.org/child-mortality) * [Fertility Rate](https://ourworldindata.org/fertility-rate) * [Life Expectancy](https://ourworldindata.org/life-expectancy) * [Age Structure](https://ourworldindata.org/age-structure) Geographical maps show us where the world's landmasses are; not where people are. That means they don't always give us an accurate picture of how global living standards are changing. One way to understand the distribution of people worldwide is to redraw the world map – not based on the area but according to population. This is shown here as a _population cartogram_: a geographical presentation of the world where the size of countries is not drawn according to the distribution of land but by the distribution of people. It’s shown for the year 2018. As the population size rather than the territory is shown in this map, you can see some significant differences when you compare it to the standard geographical map we’re most familiar with. Small countries with a high population density increase in size in this cartogram relative to the world maps we are used to – look at Bangladesh, Taiwan, or the Netherlands. Large countries with a small population shrink in size – look for Canada, Mongolia, Australia, or Russia. You can find more details on this carto… | {"id": 56663, "date": "2023-07-11T08:00:00", "guid": {"rendered": "https://owid.cloud/?page_id=56663"}, "link": "https://owid.cloud/population-growth", "meta": {"owid_publication_context_meta_field": [], "owid_key_performance_indicators_meta_field": []}, "slug": "population-growth", "tags": [], "type": "page", "title": {"rendered": "Population Growth"}, "_links": {"self": [{"href": "https://owid.cloud/wp-json/wp/v2/pages/56663"}], "about": [{"href": "https://owid.cloud/wp-json/wp/v2/types/page"}], "author": [{"href": "https://owid.cloud/wp-json/wp/v2/users/17", "embeddable": true}], "curies": [{"href": "https://api.w.org/{rel}", "name": "wp", "templated": true}], "replies": [{"href": "https://owid.cloud/wp-json/wp/v2/comments?post=56663", "embeddable": true}], "wp:term": [{"href": "https://owid.cloud/wp-json/wp/v2/categories?post=56663", "taxonomy": "category", "embeddable": true}, {"href": "https://owid.cloud/wp-json/wp/v2/tags?post=56663", "taxonomy": "post_tag", "embeddable": true}], "collection": [{"href": "https://owid.cloud/wp-json/wp/v2/pages"}], "wp:attachment": [{"href": "https://owid.cloud/wp-json/wp/v2/media?parent=56663"}], "version-history": [{"href": "https://owid.cloud/wp-json/wp/v2/pages/56663/revisions", "count": 29}], "wp:featuredmedia": [{"href": "https://owid.cloud/wp-json/wp/v2/media/56675", "embeddable": true}], "predecessor-version": [{"id": 58447, "href": "https://owid.cloud/wp-json/wp/v2/pages/56663/revisions/58447"}]}, "author": 17, "parent": 0, "status": "publish", "content": {"rendered": "\n<!-- formatting-options toc:false bodyClassName:topic-page -->\n\n\n\t<div class=\"sticky-nav-contents\">\n<li class=\" wp-block-navigation-item wp-block-navigation-link\"><a class=\"wp-block-navigation-item__content\" href=\"#introduction\"><span class=\"wp-block-navigation-item__label\">Introduction</span></a></li>\n\n<li class=\" wp-block-navigation-item wp-block-navigation-link\"><a class=\"wp-block-navigation-item__content\" href=\"#key-insights\"><span class=\"wp-block-navigation-item__label… |
| 1196 | 1196 | 56602 | We published a redesign of our work on the Ozone Layer | ozone-redesign | post | publish | {"id": "wp-56602", "slug": "ozone-redesign", "content": {"toc": [], "body": [], "type": "article", "title": "We published a redesign of our work on the Ozone Layer", "authors": ["Hannah Ritchie", "Lucas Rodés-Guirao"], "excerpt": "We published a redesign of our work on the ozone layer. Explore all of our writing and charts in one place.", "dateline": "March 13, 2023", "subtitle": "We published a redesign of our work on the ozone layer. Explore all of our writing and charts in one place.", "sidebar-toc": false, "featured-image": "Ozone-Layer.png"}, "createdAt": "2023-04-06T08:20:38.000Z", "published": false, "updatedAt": "2023-07-10T16:20:52.000Z", "revisionId": null, "publishedAt": "2023-03-13T08:20:00.000Z", "relatedCharts": [], "publicationContext": "listed"} | {"errors": [], "numBlocks": 0, "numErrors": 0, "wpTagCounts": {}, "htmlTagCounts": {}} | 2023-03-13 08:20:00 | 2024-02-16 14:22:55 | ["Hannah Ritchie", "Lucas Rodés-Guirao"] | We published a redesign of our work on the ozone layer. Explore all of our writing and charts in one place. | 2023-04-06 08:20:38 | 2023-07-10 16:20:52 | https://ourworldindata.org/wp-content/uploads/2023/03/Ozone-Layer.png | {} | {"id": 56602, "date": "2023-03-13T08:20:00", "guid": {"rendered": "https://owid.cloud/?p=56602"}, "link": "https://owid.cloud/ozone-redesign", "meta": {"owid_publication_context_meta_field": {"latest": true, "homepage": true, "immediate_newsletter": true}}, "slug": "ozone-redesign", "tags": [], "type": "post", "title": {"rendered": "We published a redesign of our work on the Ozone Layer"}, "_links": {"self": [{"href": "https://owid.cloud/wp-json/wp/v2/posts/56602"}], "about": [{"href": "https://owid.cloud/wp-json/wp/v2/types/post"}], "author": [{"href": "https://owid.cloud/wp-json/wp/v2/users/17", "embeddable": true}], "curies": [{"href": "https://api.w.org/{rel}", "name": "wp", "templated": true}], "replies": [{"href": "https://owid.cloud/wp-json/wp/v2/comments?post=56602", "embeddable": true}], "wp:term": [{"href": "https://owid.cloud/wp-json/wp/v2/categories?post=56602", "taxonomy": "category", "embeddable": true}, {"href": "https://owid.cloud/wp-json/wp/v2/tags?post=56602", "taxonomy": "post_tag", "embeddable": true}], "collection": [{"href": "https://owid.cloud/wp-json/wp/v2/posts"}], "wp:attachment": [{"href": "https://owid.cloud/wp-json/wp/v2/media?parent=56602"}], "version-history": [{"href": "https://owid.cloud/wp-json/wp/v2/posts/56602/revisions", "count": 4}], "wp:featuredmedia": [{"href": "https://owid.cloud/wp-json/wp/v2/media/56235", "embeddable": true}], "predecessor-version": [{"id": 57684, "href": "https://owid.cloud/wp-json/wp/v2/posts/56602/revisions/57684"}]}, "author": 17, "format": "standard", "status": "publish", "sticky": false, "content": {"rendered": "", "protected": false}, "excerpt": {"rendered": "We published a redesign of our work on the ozone layer. Explore all of our writing and charts in one place.", "protected": false}, "date_gmt": "2023-03-13T08:20:00", "modified": "2023-07-10T17:20:52", "template": "", "categories": [1], "ping_status": "closed", "authors_name": ["Hannah Ritchie", "Lucas Rodés-Guirao"], "modified_gmt": "2023-07-10T16:20:52", "comment_status": "closed", "featured… | |||
| 1195 | 1195 | 56533 | How does age standardization make health metrics comparable? | age-standardization | post | publish | <!-- wp:paragraph -->
<p>Age standardization can be helpful when comparing rates of health outcomes (for example, deaths from cancer) between populations, because age can be a significant risk factor for many diseases.</p>
<!-- /wp:paragraph -->
<!-- wp:paragraph -->
<p>Since age structure varies between countries and in the same country over time, this adjustment allows us to see how mortality and morbidity vary without age differences. </p>
<!-- /wp:paragraph -->
<!-- wp:paragraph -->
<p>Age standardization involves adjusting the observed rates of a particular outcome to a “standard population” with a specific age structure.</p>
<!-- /wp:paragraph -->
<!-- wp:heading {"level":4} -->
<h4>Why is it helpful to standardize health metrics for age?</h4>
<!-- /wp:heading -->
<!-- wp:paragraph -->
<p>The proportion of people in different age groups in a country is called its "age structure." Countries across the world have significant differences in age structure. For example, only <a href="https://ourworldindata.org/grapher/population-by-broad-age-group?stackMode=relative&country=~UGA">2% of the population of Uganda</a> is older than 65, against <a href="https://ourworldindata.org/grapher/population-by-broad-age-group?stackMode=relative&country=~JPN">30% in Japan</a>.</p>
<!-- /wp:paragraph -->
<!-- wp:paragraph -->
<p>But many diseases or health outcomes occur more frequently as people get older: for example, cancers, heart disease, or dementia.</p>
<!-- /wp:paragraph -->
<!-- wp:paragraph -->
<p>This difference in age structure means that a condition that affects older people will tend to occur more frequently in the Japanese population than in the Ugandan population, simply because of the higher proportion of older people in the country.</p>
<!-- /wp:paragraph -->
<!-- wp:paragraph -->
<p>Standardizing the data for age can tell us how a health condition compares between Japan and Uganda if there were no differences in the age structure of the two countries.</p>
<!-- /wp:paragraph -->
<!-- wp:he… |
{"id": "wp-56533", "slug": "age-standardization", "content": {"toc": [], "body": [{"type": "text", "value": [{"text": "Age standardization can be helpful when comparing rates of health outcomes (for example, deaths from cancer) between populations, because age can be a significant risk factor for many diseases.", "spanType": "span-simple-text"}], "parseErrors": []}, {"type": "text", "value": [{"text": "Since age structure varies between countries and in the same country over time, this adjustment allows us to see how mortality and morbidity vary without age differences. ", "spanType": "span-simple-text"}], "parseErrors": []}, {"type": "text", "value": [{"text": "Age standardization involves adjusting the observed rates of a particular outcome to a “standard population” with a specific age structure.", "spanType": "span-simple-text"}], "parseErrors": []}, {"text": [{"text": "Why is it helpful to standardize health metrics for age?", "spanType": "span-simple-text"}], "type": "heading", "level": 2, "parseErrors": []}, {"type": "text", "value": [{"text": "The proportion of people in different age groups in a country is called its \"age structure.\" Countries across the world have significant differences in age structure. For example, only ", "spanType": "span-simple-text"}, {"url": "https://ourworldindata.org/grapher/population-by-broad-age-group?stackMode=relative&country=~UGA", "children": [{"text": "2% of the population of Uganda", "spanType": "span-simple-text"}], "spanType": "span-link"}, {"text": " is older than 65, against ", "spanType": "span-simple-text"}, {"url": "https://ourworldindata.org/grapher/population-by-broad-age-group?stackMode=relative&country=~JPN", "children": [{"text": "30% in Japan", "spanType": "span-simple-text"}], "spanType": "span-link"}, {"text": ".", "spanType": "span-simple-text"}], "parseErrors": []}, {"type": "text", "value": [{"text": "But many diseases or health outcomes occur more frequently as people get older: for example, cancers, heart disease, or dementia.", "spanType": "span… | {"errors": [{"name": "unexpected wp component tag", "details": "Found unhandled wp:comment tag image"}, {"name": "unexpected wp component tag", "details": "Found unhandled wp:comment tag image"}, {"name": "unexpected wp component tag", "details": "Found unhandled wp:comment tag image"}], "numBlocks": 42, "numErrors": 3, "wpTagCounts": {"html": 1, "image": 3, "heading": 5, "paragraph": 33}, "htmlTagCounts": {"p": 33, "h4": 5, "figure": 3, "iframe": 1}} | 2023-04-04 09:58:49 | 2024-03-12 20:21:39 | 1abYtLfS2RLS4Ph2pyHXcuTg61vhxFMeUybfUHtKqMnE | ["Edouard Mathieu"] | Age standardization is a statistical method used to compare disease rates, or other health indicators, between populations while accounting for differences in their age structure. | 2023-04-04 10:42:16 | 2023-07-10 16:23:55 | https://ourworldindata.org/wp-content/uploads/2022/10/Living-planet-index-region-thumbnail.png | {} | Age standardization can be helpful when comparing rates of health outcomes (for example, deaths from cancer) between populations, because age can be a significant risk factor for many diseases. Since age structure varies between countries and in the same country over time, this adjustment allows us to see how mortality and morbidity vary without age differences. Age standardization involves adjusting the observed rates of a particular outcome to a “standard population” with a specific age structure. ## Why is it helpful to standardize health metrics for age? The proportion of people in different age groups in a country is called its "age structure." Countries across the world have significant differences in age structure. For example, only [2% of the population of Uganda](https://ourworldindata.org/grapher/population-by-broad-age-group?stackMode=relative&country=~UGA) is older than 65, against [30% in Japan](https://ourworldindata.org/grapher/population-by-broad-age-group?stackMode=relative&country=~JPN). But many diseases or health outcomes occur more frequently as people get older: for example, cancers, heart disease, or dementia. This difference in age structure means that a condition that affects older people will tend to occur more frequently in the Japanese population than in the Ugandan population, simply because of the higher proportion of older people in the country. Standardizing the data for age can tell us how a health condition compares between Japan and Uganda if there were no differences in the age structure of the two countries. ## What is a crude rate? A crude rate is the unadjusted rate of a health outcome before any age standardization is applied. Suppose a researcher wants to compare the death rate from cancer between Japan and Uganda. They would first calculate the death rate of people from cancer in each country. To calculate this, for each year, the researcher would take the number of people who died of cancer and divide it by the country's population. This is called the **crude… | {"id": 56533, "date": "2023-04-04T10:58:49", "guid": {"rendered": "https://owid.cloud/?p=56533"}, "link": "https://owid.cloud/age-standardization", "meta": {"owid_publication_context_meta_field": {"latest": true, "homepage": true, "immediate_newsletter": true}}, "slug": "age-standardization", "tags": [], "type": "post", "title": {"rendered": "How does age standardization make health metrics comparable?"}, "_links": {"self": [{"href": "https://owid.cloud/wp-json/wp/v2/posts/56533"}], "about": [{"href": "https://owid.cloud/wp-json/wp/v2/types/post"}], "author": [{"href": "https://owid.cloud/wp-json/wp/v2/users/41", "embeddable": true}], "curies": [{"href": "https://api.w.org/{rel}", "name": "wp", "templated": true}], "replies": [{"href": "https://owid.cloud/wp-json/wp/v2/comments?post=56533", "embeddable": true}], "wp:term": [{"href": "https://owid.cloud/wp-json/wp/v2/categories?post=56533", "taxonomy": "category", "embeddable": true}, {"href": "https://owid.cloud/wp-json/wp/v2/tags?post=56533", "taxonomy": "post_tag", "embeddable": true}], "collection": [{"href": "https://owid.cloud/wp-json/wp/v2/posts"}], "wp:attachment": [{"href": "https://owid.cloud/wp-json/wp/v2/media?parent=56533"}], "version-history": [{"href": "https://owid.cloud/wp-json/wp/v2/posts/56533/revisions", "count": 13}], "wp:featuredmedia": [{"href": "https://owid.cloud/wp-json/wp/v2/media/54364", "embeddable": true}], "predecessor-version": [{"id": 56593, "href": "https://owid.cloud/wp-json/wp/v2/posts/56533/revisions/56593"}]}, "author": 41, "format": "standard", "status": "publish", "sticky": false, "content": {"rendered": "\n<p>Age standardization can be helpful when comparing rates of health outcomes (for example, deaths from cancer) between populations, because age can be a significant risk factor for many diseases.</p>\n\n\n\n<p>Since age structure varies between countries and in the same country over time, this adjustment allows us to see how mortality and morbidity vary without age differences. </p>\n\n\n\n<p>Age standardization inv… |
| 1192 | 1192 | 56226 | What is the ozone layer, and why is it important? | ozone-layer-context | post | publish | <!-- wp:paragraph -->
<p>One of the most pressing environmental problems over the last century has been the depletion of the ozone layer. But what is the ozone layer, and why does it matter?</p>
<!-- /wp:paragraph -->
<!-- wp:paragraph -->
<p>Ozone is a gas present naturally within Earth’s atmosphere. It is formed of three oxygen atoms (giving it the chemical formula O<sub>3</sub>). Its structure makes it unstable: it can be easily formed and broken down through interaction with other compounds.</p>
<!-- /wp:paragraph -->
<!-- wp:paragraph -->
<p>Ozone is most highly concentrated at two very different altitudes in the atmosphere: near the surface, and high in the atmosphere (in the stratosphere). Its function is very different in these two zones.</p>
<!-- /wp:paragraph -->
<!-- wp:heading {"level":3} -->
<h3>‘Good ozone’ and ‘bad ozone’</h3>
<!-- /wp:heading -->
<!-- wp:columns -->
<div class="wp-block-columns"><!-- wp:column -->
<div class="wp-block-column"><!-- wp:paragraph -->
<p>Ozone close to the surface is called tropospheric ozone, and it is often referred to as ‘<strong>bad ozone</strong>’. Ozone concentrations are lower in the troposphere than in the stratosphere.</p>
<!-- /wp:paragraph -->
<!-- wp:paragraph -->
<p>We can see this in the diagram. </p>
<!-- /wp:paragraph -->
<!-- wp:paragraph -->
<p>However, ozone concentrations close to the Earth’s surface can be temporarily and locally higher, because of emissions from motor vehicle exhausts, industrial processes, electric utilities, and chemical solvents. Ground-level ozone is a local air pollutant, and can negatively impact human health. Breathing ozone is particularly harmful to the young, elderly, and people with underlying respiratory problems.</p>
<!-- /wp:paragraph -->
<!-- wp:paragraph -->
<p>This is very different from ozone high in the atmosphere: stratospheric ozone. It’s referred to as ‘<strong>good ozone</strong>’.</p>
<!-- /wp:paragraph -->
<!-- wp:paragraph -->
<p>As shown in the diagram, ozone concentrations are higher in th… |
{"id": "wp-56226", "slug": "ozone-layer-context", "content": {"toc": [], "body": [{"type": "text", "value": [{"text": "One of the most pressing environmental problems over the last century has been the depletion of the ozone layer. But what is the ozone layer, and why does it matter?", "spanType": "span-simple-text"}], "parseErrors": []}, {"type": "text", "value": [{"text": "Ozone is a gas present naturally within Earth’s atmosphere. It is formed of three oxygen atoms (giving it the chemical formula O", "spanType": "span-simple-text"}, {"children": [{"text": "3", "spanType": "span-simple-text"}], "spanType": "span-subscript"}, {"text": "). Its structure makes it unstable: it can be easily formed and broken down through interaction with other compounds.", "spanType": "span-simple-text"}], "parseErrors": []}, {"type": "text", "value": [{"text": "Ozone is most highly concentrated at two very different altitudes in the atmosphere: near the surface, and high in the atmosphere (in the stratosphere). Its function is very different in these two zones.", "spanType": "span-simple-text"}], "parseErrors": []}, {"text": [{"text": "‘Good ozone’ and ‘bad ozone’", "spanType": "span-simple-text"}], "type": "heading", "level": 2, "parseErrors": []}, {"left": [{"type": "text", "value": [{"text": "Ozone close to the surface is called tropospheric ozone, and it is often referred to as ‘", "spanType": "span-simple-text"}, {"children": [{"text": "bad ozone", "spanType": "span-simple-text"}], "spanType": "span-bold"}, {"text": "’. Ozone concentrations are lower in the troposphere than in the stratosphere.", "spanType": "span-simple-text"}], "parseErrors": []}, {"type": "text", "value": [{"text": "We can see this in the diagram. ", "spanType": "span-simple-text"}], "parseErrors": []}, {"type": "text", "value": [{"text": "However, ozone concentrations close to the Earth’s surface can be temporarily and locally higher, because of emissions from motor vehicle exhausts, industrial processes, electric utilities, and chemical solvents. Ground-… | {"errors": [{"name": "unexpected wp component tag", "details": "Found unhandled wp:comment tag image"}, {"name": "unexpected wp component tag", "details": "Found unhandled wp:comment tag image"}], "numBlocks": 7, "numErrors": 2, "wpTagCounts": {"image": 2, "column": 4, "columns": 2, "heading": 2, "paragraph": 24}, "htmlTagCounts": {"p": 24, "h3": 2, "div": 6, "figure": 2}} | 2023-03-13 11:43:52 | 2024-03-10 13:24:51 | 17WPmagexHbBoZONvona_NXGOvlkklsUIQE7mEd81uMo | ["Hannah Ritchie"] | Over the last 50 years, holes in the ozone layer have opened up. Why does that matter for life on Earth? | 2023-03-13 11:43:52 | 2023-03-13 12:22:08 | https://ourworldindata.org/wp-content/uploads/2023/03/Ozone-layer-context-featured.png | {} | One of the most pressing environmental problems over the last century has been the depletion of the ozone layer. But what is the ozone layer, and why does it matter? Ozone is a gas present naturally within Earth’s atmosphere. It is formed of three oxygen atoms (giving it the chemical formula O3). Its structure makes it unstable: it can be easily formed and broken down through interaction with other compounds. Ozone is most highly concentrated at two very different altitudes in the atmosphere: near the surface, and high in the atmosphere (in the stratosphere). Its function is very different in these two zones. ## ‘Good ozone’ and ‘bad ozone’ Ozone close to the surface is called tropospheric ozone, and it is often referred to as ‘**bad ozone**’. Ozone concentrations are lower in the troposphere than in the stratosphere. We can see this in the diagram. However, ozone concentrations close to the Earth’s surface can be temporarily and locally higher, because of emissions from motor vehicle exhausts, industrial processes, electric utilities, and chemical solvents. Ground-level ozone is a local air pollutant, and can negatively impact human health. Breathing ozone is particularly harmful to the young, elderly, and people with underlying respiratory problems. This is very different from ozone high in the atmosphere: stratospheric ozone. It’s referred to as ‘**good ozone**’. As shown in the diagram, ozone concentrations are higher in the stratosphere than in the troposphere. The stratosphere includes the zone commonly called the ‘ozone layer’. It plays a crucial role in keeping the planet habitable by absorbing potentially dangerous ultraviolet (UV-B) radiation from the sun. Before its depletion, the ozone layer typically absorbed 97 to 99% of incoming UV-B radiation. This means we need high ozone concentrations in the stratosphere to ensure that life — including human life — is not exposed to harmful concentrations of UV-B radiation. In our work on the [ozone layer](http://ourworldindata.org/ozone-layer), we… | {"id": 56226, "date": "2023-03-13T11:43:52", "guid": {"rendered": "https://owid.cloud/?p=56226"}, "link": "https://owid.cloud/ozone-layer-context", "meta": {"owid_publication_context_meta_field": []}, "slug": "ozone-layer-context", "tags": [], "type": "post", "title": {"rendered": "What is the ozone layer, and why is it important?"}, "_links": {"self": [{"href": "https://owid.cloud/wp-json/wp/v2/posts/56226"}], "about": [{"href": "https://owid.cloud/wp-json/wp/v2/types/post"}], "author": [{"href": "https://owid.cloud/wp-json/wp/v2/users/17", "embeddable": true}], "curies": [{"href": "https://api.w.org/{rel}", "name": "wp", "templated": true}], "replies": [{"href": "https://owid.cloud/wp-json/wp/v2/comments?post=56226", "embeddable": true}], "wp:term": [{"href": "https://owid.cloud/wp-json/wp/v2/categories?post=56226", "taxonomy": "category", "embeddable": true}, {"href": "https://owid.cloud/wp-json/wp/v2/tags?post=56226", "taxonomy": "post_tag", "embeddable": true}], "collection": [{"href": "https://owid.cloud/wp-json/wp/v2/posts"}], "wp:attachment": [{"href": "https://owid.cloud/wp-json/wp/v2/media?parent=56226"}], "version-history": [{"href": "https://owid.cloud/wp-json/wp/v2/posts/56226/revisions", "count": 1}], "wp:featuredmedia": [{"href": "https://owid.cloud/wp-json/wp/v2/media/56230", "embeddable": true}], "predecessor-version": [{"id": 56228, "href": "https://owid.cloud/wp-json/wp/v2/posts/56226/revisions/56228"}]}, "author": 17, "format": "standard", "status": "publish", "sticky": false, "content": {"rendered": "\n<p>One of the most pressing environmental problems over the last century has been the depletion of the ozone layer. But what is the ozone layer, and why does it matter?</p>\n\n\n\n<p>Ozone is a gas present naturally within Earth’s atmosphere. It is formed of three oxygen atoms (giving it the chemical formula O<sub>3</sub>). Its structure makes it unstable: it can be easily formed and broken down through interaction with other compounds.</p>\n\n\n\n<p>Ozone is most highly concentrated at two ver… |
| 1191 | 1191 | 56182 | What is Moore's Law? | moores-law | post | publish | <!-- wp:columns {"className":"is-style-sticky-right"} -->
<div class="wp-block-columns is-style-sticky-right"><!-- wp:column -->
<div class="wp-block-column"><!-- wp:paragraph -->
<p>The observation that the number of transistors on computer chips doubles approximately every two years is known as Moore’s Law.</p>
<!-- /wp:paragraph -->
<!-- wp:paragraph -->
<p>Moore’s Law is not a law of nature, but an observation of a long-term trend in how technology is changing.</p>
<!-- /wp:paragraph -->
<!-- wp:paragraph -->
<p>The law was first described by Gordon E. Moore, the co-founder of Intel, in 1965.{ref}The original paper is Gordon E. Moore (1965) – <a href="https://web.archive.org/web/20211221191553/http://www.monolithic3d.com/uploads/6/0/5/5/6055488/gordon_moore_1965_article.pdf">Cramming more components onto integrated circuits</a>. In Electronics, Volume 38, Number 8, April 19, 1965.{/ref} </p>
<!-- /wp:paragraph -->
<!-- wp:paragraph -->
<p>The chart shows Moore’s original graph that he drew in 1965 to describe this regularity. At the time, he had only a handful of data points. Note that he drew it on a logarithmic scale, and remember that a straight line on a log-axis means that the <em>growth rate</em> is constant and it is therefore showing the exponential growth of the number of transistors.</p>
<!-- /wp:paragraph -->
<!-- wp:paragraph -->
<p>However, he hypothesized that this relationship would continue at a similar rate: “There is no reason to believe it will not remain constant for at least 10 years”.{ref}Quoted from Gordon E. Moore (1965) – <a href="https://web.archive.org/web/20211221191553/http://www.monolithic3d.com/uploads/6/0/5/5/6055488/gordon_moore_1965_article.pdf">Cramming more components onto integrated circuits</a>. In Electronics, Volume 38, Number 8, April 19, 1965.{/ref}</p>
<!-- /wp:paragraph -->
<!-- wp:paragraph -->
<p></p>
<!-- /wp:paragraph --></div>
<!-- /wp:column -->
<!-- wp:column -->
<div class="wp-block-column"><!-- wp:image {"align":"center","id":3954,"linkDestinatio… |
{"id": "wp-56182", "slug": "moores-law", "content": {"toc": [], "body": [{"left": [{"type": "text", "value": [{"text": "The observation that the number of transistors on computer chips doubles approximately every two years is known as Moore’s Law.", "spanType": "span-simple-text"}], "parseErrors": []}, {"type": "text", "value": [{"text": "Moore’s Law is not a law of nature, but an observation of a long-term trend in how technology is changing.", "spanType": "span-simple-text"}], "parseErrors": []}, {"type": "text", "value": [{"text": "The law was first described by Gordon E. Moore, the co-founder of Intel, in 1965.{ref}The original paper is Gordon E. Moore (1965) – ", "spanType": "span-simple-text"}, {"url": "https://web.archive.org/web/20211221191553/http://www.monolithic3d.com/uploads/6/0/5/5/6055488/gordon_moore_1965_article.pdf", "children": [{"text": "Cramming more components onto integrated circuits", "spanType": "span-simple-text"}], "spanType": "span-link"}, {"text": ". In Electronics, Volume 38, Number 8, April 19, 1965.{/ref} ", "spanType": "span-simple-text"}], "parseErrors": []}, {"type": "text", "value": [{"text": "The chart shows Moore’s original graph that he drew in 1965 to describe this regularity. At the time, he had only a handful of data points. Note that he drew it on a logarithmic scale, and remember that a straight line on a log-axis means that the ", "spanType": "span-simple-text"}, {"children": [{"text": "growth rate", "spanType": "span-simple-text"}], "spanType": "span-italic"}, {"text": " is constant and it is therefore showing the exponential growth of the number of transistors.", "spanType": "span-simple-text"}], "parseErrors": []}, {"type": "text", "value": [{"text": "However, he hypothesized that this relationship would continue at a similar rate: “There is no reason to believe it will not remain constant for at least 10 years”.{ref}Quoted from Gordon E. Moore (1965) – ", "spanType": "span-simple-text"}, {"url": "https://web.archive.org/web/20211221191553/http://www.monolithic3d.com… | {"errors": [{"name": "unexpected wp component tag", "details": "Found unhandled wp:comment tag image"}, {"name": "unexpected wp component tag", "details": "Found unhandled wp:comment tag image"}], "numBlocks": 8, "numErrors": 2, "wpTagCounts": {"html": 2, "image": 2, "column": 10, "columns": 5, "heading": 3, "paragraph": 19}, "htmlTagCounts": {"p": 19, "h3": 2, "h4": 1, "div": 16, "figure": 2, "iframe": 2}} | 2023-03-28 07:03:00 | 2024-02-16 14:22:55 | 12hNREWcrwyOrJugzc7gYHN5Qv_UJBJ-GnY_FzMbXByE | ["Max Roser", "Hannah Ritchie", "Edouard Mathieu"] | Exponential growth is at the heart of the rapid increase of computing capabilities. | 2023-03-06 08:03:00 | 2023-07-10 16:21:45 | https://ourworldindata.org/wp-content/uploads/2023/03/Moores-Law-01.png | {} | The observation that the number of transistors on computer chips doubles approximately every two years is known as Moore’s Law. Moore’s Law is not a law of nature, but an observation of a long-term trend in how technology is changing. The law was first described by Gordon E. Moore, the co-founder of Intel, in 1965.{ref}The original paper is Gordon E. Moore (1965) – [Cramming more components onto integrated circuits](https://web.archive.org/web/20211221191553/http://www.monolithic3d.com/uploads/6/0/5/5/6055488/gordon_moore_1965_article.pdf). In Electronics, Volume 38, Number 8, April 19, 1965.{/ref} The chart shows Moore’s original graph that he drew in 1965 to describe this regularity. At the time, he had only a handful of data points. Note that he drew it on a logarithmic scale, and remember that a straight line on a log-axis means that the _growth rate_ is constant and it is therefore showing the exponential growth of the number of transistors. However, he hypothesized that this relationship would continue at a similar rate: “There is no reason to believe it will not remain constant for at least 10 years”.{ref}Quoted from Gordon E. Moore (1965) – [Cramming more components onto integrated circuits](https://web.archive.org/web/20211221191553/http://www.monolithic3d.com/uploads/6/0/5/5/6055488/gordon_moore_1965_article.pdf). In Electronics, Volume 38, Number 8, April 19, 1965.{/ref} <Image filename="The-Number-of-Components-per-Integrated-Function-Moores-Original-Graph-Moore0.png" alt="The Number of Components per Integrated Function Moore's Original Graph - Moore0"/> ## Moore’s Law has held true for more than half a century In 1965, Gordon Moore predicted that this growth would continue for another 10 years, at least. Was he right? In the chart, we’ve visualized the growth in transistor density – the number of transistors on integrated circuits – from 1970 onwards. It looks strikingly similar to Moore’s simple plot from 1965. Note again that the transistor count is on a logarithmic axis, so the linear … | {"id": 56182, "date": "2023-03-28T08:03:00", "guid": {"rendered": "https://owid.cloud/?p=56182"}, "link": "https://owid.cloud/moores-law", "meta": {"owid_publication_context_meta_field": {"latest": true, "homepage": true, "immediate_newsletter": true}}, "slug": "moores-law", "tags": [], "type": "post", "title": {"rendered": "What is Moore’s Law?"}, "_links": {"self": [{"href": "https://owid.cloud/wp-json/wp/v2/posts/56182"}], "about": [{"href": "https://owid.cloud/wp-json/wp/v2/types/post"}], "author": [{"href": "https://owid.cloud/wp-json/wp/v2/users/2", "embeddable": true}], "curies": [{"href": "https://api.w.org/{rel}", "name": "wp", "templated": true}], "replies": [{"href": "https://owid.cloud/wp-json/wp/v2/comments?post=56182", "embeddable": true}], "wp:term": [{"href": "https://owid.cloud/wp-json/wp/v2/categories?post=56182", "taxonomy": "category", "embeddable": true}, {"href": "https://owid.cloud/wp-json/wp/v2/tags?post=56182", "taxonomy": "post_tag", "embeddable": true}], "collection": [{"href": "https://owid.cloud/wp-json/wp/v2/posts"}], "wp:attachment": [{"href": "https://owid.cloud/wp-json/wp/v2/media?parent=56182"}], "version-history": [{"href": "https://owid.cloud/wp-json/wp/v2/posts/56182/revisions", "count": 4}], "wp:featuredmedia": [{"href": "https://owid.cloud/wp-json/wp/v2/media/56461", "embeddable": true}], "predecessor-version": [{"id": 56472, "href": "https://owid.cloud/wp-json/wp/v2/posts/56182/revisions/56472"}]}, "author": 2, "format": "standard", "status": "publish", "sticky": false, "content": {"rendered": "\n<div class=\"wp-block-columns is-style-sticky-right\">\n<div class=\"wp-block-column\">\n<p>The observation that the number of transistors on computer chips doubles approximately every two years is known as Moore’s Law.</p>\n\n\n\n<p>Moore’s Law is not a law of nature, but an observation of a long-term trend in how technology is changing.</p>\n\n\n\n<p>The law was first described by Gordon E. Moore, the co-founder of Intel, in 1965.{ref}The original paper is Gordon E. Moore (… |
| 1189 | 1189 | 56089 | Our World in Data will rely on data from the WHO to track confirmed COVID-19 cases and deaths | covid-jhu-who | post | publish | <!-- wp:paragraph --> <p>Johns Hopkins University has been at the forefront of collecting and reporting data on confirmed COVID-19 cases and deaths since the outbreak began in 2020. However, it <a href="https://github.com/CSSEGISandData/COVID-19/issues/6577">recently announced</a> that it would stop updating its data on 10 March 2023.</p> <!-- /wp:paragraph --> <!-- wp:paragraph --> <p>Our team at Our World in Data recognizes the importance of up-to-date data on the pandemic. We will switch our primary source to <a href="https://covid19.who.int/data">the World Health Organization (WHO)</a>, which updates its dataset weekly.</p> <!-- /wp:paragraph --> <!-- wp:paragraph --> <p>To keep this data consistent over time, we will replace the entire time series with WHO data on 8 March 2023.</p> <!-- /wp:paragraph --> <!-- wp:paragraph --> <p>Our goal is to continue providing the most complete and timely data on the pandemic, and relying on the WHO data is the best way to achieve this.</p> <!-- /wp:paragraph --> <!-- wp:paragraph --> <p>This change will be seamless for our users. The URL of all our charts and the variable names in our dataset will remain the same.</p> <!-- /wp:paragraph --> <!-- wp:paragraph --> <p><a href="https://github.com/owid/covid-19-data/tree/master/public/data">All other COVID-19 datasets</a> we maintain will remain unchanged.</p> <!-- /wp:paragraph --> <!-- wp:paragraph --> <p>An archive of the last version (8 March 2023) of our dataset based on data from Johns Hopkins University is available for download <a href="https://covid.ourworldindata.org/data/owid-covid-data-old.csv">here</a> (CSV file, 69 Mo).</p> <!-- /wp:paragraph --> <!-- wp:paragraph --> <p>We want to take this opportunity to thank the team at Johns Hopkins for their crucial work since the beginning of the pandemic. Their efforts have been invaluable in helping us understand the impact of this virus across the world.</p> <!-- /wp:paragraph --> |
{"id": "wp-56089", "slug": "covid-jhu-who", "content": {"toc": [], "body": [{"type": "text", "value": [{"text": "Johns Hopkins University has been at the forefront of collecting and reporting data on confirmed COVID-19 cases and deaths since the outbreak began in 2020. However, it ", "spanType": "span-simple-text"}, {"url": "https://github.com/CSSEGISandData/COVID-19/issues/6577", "children": [{"text": "recently announced", "spanType": "span-simple-text"}], "spanType": "span-link"}, {"text": " that it would stop updating its data on 10 March 2023.", "spanType": "span-simple-text"}], "parseErrors": []}, {"type": "text", "value": [{"text": "Our team at Our World in Data recognizes the importance of up-to-date data on the pandemic. We will switch our primary source to ", "spanType": "span-simple-text"}, {"url": "https://covid19.who.int/data", "children": [{"text": "the World Health Organization (WHO)", "spanType": "span-simple-text"}], "spanType": "span-link"}, {"text": ", which updates its dataset weekly.", "spanType": "span-simple-text"}], "parseErrors": []}, {"type": "text", "value": [{"text": "To keep this data consistent over time, we will replace the entire time series with WHO data on 8 March 2023.", "spanType": "span-simple-text"}], "parseErrors": []}, {"type": "text", "value": [{"text": "Our goal is to continue providing the most complete and timely data on the pandemic, and relying on the WHO data is the best way to achieve this.", "spanType": "span-simple-text"}], "parseErrors": []}, {"type": "text", "value": [{"text": "This change will be seamless for our users. The URL of all our charts and the variable names in our dataset will remain the same.", "spanType": "span-simple-text"}], "parseErrors": []}, {"type": "text", "value": [{"url": "https://github.com/owid/covid-19-data/tree/master/public/data", "children": [{"text": "All other COVID-19 datasets", "spanType": "span-simple-text"}], "spanType": "span-link"}, {"text": " we maintain will remain unchanged.", "spanType": "span-simple-text"}], "parseErrors"… | {"errors": [], "numBlocks": 8, "numErrors": 0, "wpTagCounts": {"paragraph": 8}, "htmlTagCounts": {"p": 8}} | 2023-02-28 12:49:05 | 2024-03-10 13:18:58 | 1pB2dwxPSw-i1TWhuEJqx6n3jBTwxB9bMJQNyinB6NOg | ["Edouard Mathieu", "Lucas Rodés-Guirao"] | Johns Hopkins University will stop publishing data on confirmed COVID-19 cases and deaths. Our team will replace our entire time series with WHO's weekly-updated data on 8 March. This change will not affect users of our charts and dataset. | 2023-02-28 12:45:15 | 2023-03-13 11:40:47 | https://ourworldindata.org/wp-content/uploads/2021/02/coronavirus.png | {} | Johns Hopkins University has been at the forefront of collecting and reporting data on confirmed COVID-19 cases and deaths since the outbreak began in 2020. However, it [recently announced](https://github.com/CSSEGISandData/COVID-19/issues/6577) that it would stop updating its data on 10 March 2023. Our team at Our World in Data recognizes the importance of up-to-date data on the pandemic. We will switch our primary source to [the World Health Organization (WHO)](https://covid19.who.int/data), which updates its dataset weekly. To keep this data consistent over time, we will replace the entire time series with WHO data on 8 March 2023. Our goal is to continue providing the most complete and timely data on the pandemic, and relying on the WHO data is the best way to achieve this. This change will be seamless for our users. The URL of all our charts and the variable names in our dataset will remain the same. [All other COVID-19 datasets](https://github.com/owid/covid-19-data/tree/master/public/data) we maintain will remain unchanged. An archive of the last version (8 March 2023) of our dataset based on data from Johns Hopkins University is available for download [here](https://covid.ourworldindata.org/data/owid-covid-data-old.csv) (CSV file, 69 Mo). We want to take this opportunity to thank the team at Johns Hopkins for their crucial work since the beginning of the pandemic. Their efforts have been invaluable in helping us understand the impact of this virus across the world. | {"id": 56089, "date": "2023-02-28T12:49:05", "guid": {"rendered": "https://owid.cloud/?p=56089"}, "link": "https://owid.cloud/covid-jhu-who", "meta": {"owid_publication_context_meta_field": []}, "slug": "covid-jhu-who", "tags": [199], "type": "post", "title": {"rendered": "Our World in Data will rely on data from the WHO to track confirmed COVID-19 cases and deaths"}, "_links": {"self": [{"href": "https://owid.cloud/wp-json/wp/v2/posts/56089"}], "about": [{"href": "https://owid.cloud/wp-json/wp/v2/types/post"}], "author": [{"href": "https://owid.cloud/wp-json/wp/v2/users/41", "embeddable": true}], "curies": [{"href": "https://api.w.org/{rel}", "name": "wp", "templated": true}], "replies": [{"href": "https://owid.cloud/wp-json/wp/v2/comments?post=56089", "embeddable": true}], "wp:term": [{"href": "https://owid.cloud/wp-json/wp/v2/categories?post=56089", "taxonomy": "category", "embeddable": true}, {"href": "https://owid.cloud/wp-json/wp/v2/tags?post=56089", "taxonomy": "post_tag", "embeddable": true}], "collection": [{"href": "https://owid.cloud/wp-json/wp/v2/posts"}], "wp:attachment": [{"href": "https://owid.cloud/wp-json/wp/v2/media?parent=56089"}], "version-history": [{"href": "https://owid.cloud/wp-json/wp/v2/posts/56089/revisions", "count": 4}], "wp:featuredmedia": [{"href": "https://owid.cloud/wp-json/wp/v2/media/39688", "embeddable": true}], "predecessor-version": [{"id": 56227, "href": "https://owid.cloud/wp-json/wp/v2/posts/56089/revisions/56227"}]}, "author": 41, "format": "standard", "status": "publish", "sticky": false, "content": {"rendered": "\n<p>Johns Hopkins University has been at the forefront of collecting and reporting data on confirmed COVID-19 cases and deaths since the outbreak began in 2020. However, it <a href=\"https://github.com/CSSEGISandData/COVID-19/issues/6577\">recently announced</a> that it would stop updating its data on 10 March 2023.</p>\n\n\n\n<p>Our team at Our World in Data recognizes the importance of up-to-date data on the pandemic. We will switch our primary source to <a h… |
| 1188 | 1188 | 56065 | how do we choose metrics? | how-do-we-choose-metrics | wp_block | publish | <!-- wp:paragraph --> <p>For each topic, we work to provide the best metrics to understand it. What metrics are 'best' will often depend on our specific questions. Overall, a metric we provide will fit many of the following criteria:</p> <!-- /wp:paragraph --> <!-- wp:list --> <ul><li><strong>It covers large parts of the world. </strong>True to our name, we seek metrics which cover as much of the world as possible. Only then can they help us understand global differences and changes.</li></ul> <!-- /wp:list --> <!-- wp:paragraph --> <p></p> <!-- /wp:paragraph --> <!-- wp:list --> <ul><li><strong>It covers a lot of time. </strong>This means both that the measure goes as far back in time as possible, and that it is as recent as possible. It then can help us understand both historical and very recent developments.</li></ul> <!-- /wp:list --> <!-- wp:paragraph --> <p></p> <!-- /wp:paragraph --> <!-- wp:list --> <ul><li><strong>It is comparable across time and space</strong>. This means that we prefer metrics that can be compared across years and countries. This allows us to evaluate whether countries are making progress or falling behind, and how countries are doing relative to another.</li></ul> <!-- /wp:list --> <!-- wp:paragraph --> <p></p> <!-- /wp:paragraph --> <!-- wp:list --> <ul><li><strong>It captures what we are trying to measure</strong>. This means that the metric does not give an incomplete or misleading answer to the question we have. For example, an inadequate measure for whether a country is a democracy is the share of the population that voted. Looking only at voter turnout ignores whether citizens had more than one choice at the ballot box. And at the same time, it inadvertently considers citizens that were coerced to vote.</li></ul> <!-- /wp:list --> <!-- wp:paragraph --> <p></p> <!-- /wp:paragraph --> <!-- wp:list --> <ul><li><strong>It is reliable.</strong> This means that the metric is consistent, i.e. it captures the phenomenon similarly when measured repeatedly, and therefore is preci… |
{"id": "wp-56065", "slug": "how-do-we-choose-metrics", "content": {"toc": [], "body": [{"type": "text", "value": [{"text": "For each topic, we work to provide the best metrics to understand it. What metrics are 'best' will often depend on our specific questions. Overall, a metric we provide will fit many of the following criteria:", "spanType": "span-simple-text"}], "parseErrors": []}, {"type": "list", "items": [{"type": "text", "value": [{"children": [{"text": "It covers large parts of the world. ", "spanType": "span-simple-text"}], "spanType": "span-bold"}, {"text": "True to our name, we seek metrics which cover as much of the world as possible. Only then can they help us understand global differences and changes.", "spanType": "span-simple-text"}], "parseErrors": []}], "parseErrors": []}, {"type": "list", "items": [{"type": "text", "value": [{"children": [{"text": "It covers a lot of time. ", "spanType": "span-simple-text"}], "spanType": "span-bold"}, {"text": "This means both that the measure goes as far back in time as possible, and that it is as recent as possible. It then can help us understand both historical and very recent developments.", "spanType": "span-simple-text"}], "parseErrors": []}], "parseErrors": []}, {"type": "list", "items": [{"type": "text", "value": [{"children": [{"text": "It is comparable across time and space", "spanType": "span-simple-text"}], "spanType": "span-bold"}, {"text": ". This means that we prefer metrics that can be compared across years and countries. This allows us to evaluate whether countries are making progress or falling behind, and how countries are doing relative to another.", "spanType": "span-simple-text"}], "parseErrors": []}], "parseErrors": []}, {"type": "list", "items": [{"type": "text", "value": [{"children": [{"text": "It captures what we are trying to measure", "spanType": "span-simple-text"}], "spanType": "span-bold"}, {"text": ". This means that the metric does not give an incomplete or misleading answer to the question we have. For example, an inadequate … | {"errors": [{"name": "unexpected wp component tag", "details": "Found unhandled wp:comment tag list"}, {"name": "unexpected wp component tag", "details": "Found unhandled wp:comment tag list"}, {"name": "unexpected wp component tag", "details": "Found unhandled wp:comment tag list"}, {"name": "unexpected wp component tag", "details": "Found unhandled wp:comment tag list"}, {"name": "unexpected wp component tag", "details": "Found unhandled wp:comment tag list"}, {"name": "unexpected wp component tag", "details": "Found unhandled wp:comment tag list"}, {"name": "unexpected wp component tag", "details": "Found unhandled wp:comment tag list"}, {"name": "unexpected wp component tag", "details": "Found unhandled wp:comment tag list"}, {"name": "unexpected wp component tag", "details": "Found unhandled wp:comment tag list"}, {"name": "unexpected wp component tag", "details": "Found unhandled wp:comment tag list"}, {"name": "unexpected wp component tag", "details": "Found unhandled wp:comment tag list"}], "numBlocks": 13, "numErrors": 11, "wpTagCounts": {"list": 11, "paragraph": 13}, "htmlTagCounts": {"p": 13, "ul": 11}} | 2023-02-27 09:05:29 | 2024-02-16 14:23:03 | [null] | 2023-02-27 09:05:29 | {} | For each topic, we work to provide the best metrics to understand it. What metrics are 'best' will often depend on our specific questions. Overall, a metric we provide will fit many of the following criteria: * **It covers large parts of the world. **True to our name, we seek metrics which cover as much of the world as possible. Only then can they help us understand global differences and changes. * **It covers a lot of time. **This means both that the measure goes as far back in time as possible, and that it is as recent as possible. It then can help us understand both historical and very recent developments. * **It is comparable across time and space**. This means that we prefer metrics that can be compared across years and countries. This allows us to evaluate whether countries are making progress or falling behind, and how countries are doing relative to another. * **It captures what we are trying to measure**. This means that the metric does not give an incomplete or misleading answer to the question we have. For example, an inadequate measure for whether a country is a democracy is the share of the population that voted. Looking only at voter turnout ignores whether citizens had more than one choice at the ballot box. And at the same time, it inadvertently considers citizens that were coerced to vote. * **It is reliable.** This means that the metric is consistent, i.e. it captures the phenomenon similarly when measured repeatedly, and therefore is precise, and captures the phenomenon with little error. A consistent and precise metric makes us more confident in what it tells us about the world. * **Its construction is transparent.** This means that we prefer metrics that come with a detailed description of how it was constructed, why it was constructed in this way, and with the underlying code and raw data. We, and you as our reader, then can evaluate its strengths and weaknesses in detail. * **It is easy to understand**. This means that the metric captures something that people are broadly familiar w… | {"data": {"wpBlock": {"content": "\n<p>For each topic, we work to provide the best metrics to understand it. What metrics are ‘best’ will often depend on our specific questions. Overall, a metric we provide will fit many of the following criteria:</p>\n\n\n\n<ul><li><strong>It covers large parts of the world. </strong>True to our name, we seek metrics which cover as much of the world as possible. Only then can they help us understand global differences and changes.</li></ul>\n\n\n\n<p></p>\n\n\n\n<ul><li><strong>It covers a lot of time. </strong>This means both that the measure goes as far back in time as possible, and that it is as recent as possible. It then can help us understand both historical and very recent developments.</li></ul>\n\n\n\n<p></p>\n\n\n\n<ul><li><strong>It is comparable across time and space</strong>. This means that we prefer metrics that can be compared across years and countries. This allows us to evaluate whether countries are making progress or falling behind, and how countries are doing relative to another.</li></ul>\n\n\n\n<p></p>\n\n\n\n<ul><li><strong>It captures what we are trying to measure</strong>. This means that the metric does not give an incomplete or misleading answer to the question we have. For example, an inadequate measure for whether a country is a democracy is the share of the population that voted. Looking only at voter turnout ignores whether citizens had more than one choice at the ballot box. And at the same time, it inadvertently considers citizens that were coerced to vote.</li></ul>\n\n\n\n<p></p>\n\n\n\n<ul><li><strong>It is reliable.</strong> This means that the metric is consistent, i.e. it captures the phenomenon similarly when measured repeatedly, and therefore is precise, and captures the phenomenon with little error. A consistent and precise metric makes us more confident in what it tells us about the world.</li></ul>\n\n\n\n<p></p>\n\n\n\n<ul><li><strong>Its construction is transparent.</strong> This means that we prefer metrics that come wi… | ||||
| 1187 | 1187 | 56064 | how do we choose topics? | how-do-we-choose-topics | wp_block | publish | <!-- wp:paragraph --> <p>We cover a topic if we believe it helps our readers understand one or several of the world’s largest problems. More specifically, this means that a topic will fit many of the following criteria:</p> <!-- /wp:paragraph --> <!-- wp:paragraph --> <p></p> <!-- /wp:paragraph --> <!-- wp:list --> <ul><li><strong>It affects many countries and people.</strong> This can mean that it concerns every person, such as <a href="https://ourworldindata.org/health-meta">health</a>. It can mean that it affects many people in all countries, such as <a href="https://ourworldindata.org/poverty">poverty</a>. Or it can mean that it affects many people in fewer countries, such as <a href="https://ourworldindata.org/malaria">malaria</a>.</li></ul> <!-- /wp:list --> <!-- wp:paragraph --> <p></p> <!-- /wp:paragraph --> <!-- wp:list --> <ul><li><strong>It comes with great costs or benefits. </strong>The costs or benefits can be direct, and shorten people’s lives or mean they lead happier lives. An example is the <a href="https://ourworldindata.org/coronavirus">COVID-19 pandemic</a>, which has immediately affected people’s well-being. But the costs or benefits can also be indirect, and worsen or alleviate other problems. An example is <a href="https://ourworldindata.org/agricultural-production">agricultural production</a>, which affects many people’s access to nutrition.</li></ul> <!-- /wp:list --> <!-- wp:paragraph --> <p></p> <!-- /wp:paragraph --> <!-- wp:list --> <ul><li><strong>It poses significant risks.</strong> This means that it may not impose great costs at the moment, but may do so in the future. An example is <a href="https://ourworldindata.org/nuclear-weapons">nuclear weapons</a>, which have not been used in decades but whose use would be devastating.</li></ul> <!-- /wp:list --> <!-- wp:paragraph --> <p></p> <!-- /wp:paragraph --> <!-- wp:list --> <ul><li><strong>It will remain important, or become more important in the future.</strong> <a href="https://ourworldindata.org/poverty">Poverty</a> is a… |
{"id": "wp-56064", "slug": "how-do-we-choose-topics", "content": {"toc": [], "body": [{"type": "text", "value": [{"text": "We cover a topic if we believe it helps our readers understand one or several of the world’s largest problems. More specifically, this means that a topic will fit many of the following criteria:", "spanType": "span-simple-text"}], "parseErrors": []}, {"type": "list", "items": [{"type": "text", "value": [{"children": [{"text": "It affects many countries and people.", "spanType": "span-simple-text"}], "spanType": "span-bold"}, {"text": " This can mean that it concerns every person, such as ", "spanType": "span-simple-text"}, {"url": "https://ourworldindata.org/health-meta", "children": [{"text": "health", "spanType": "span-simple-text"}], "spanType": "span-link"}, {"text": ". It can mean that it affects many people in all countries, such as ", "spanType": "span-simple-text"}, {"url": "https://ourworldindata.org/poverty", "children": [{"text": "poverty", "spanType": "span-simple-text"}], "spanType": "span-link"}, {"text": ". Or it can mean that it affects many people in fewer countries, such as ", "spanType": "span-simple-text"}, {"url": "https://ourworldindata.org/malaria", "children": [{"text": "malaria", "spanType": "span-simple-text"}], "spanType": "span-link"}, {"text": ".", "spanType": "span-simple-text"}], "parseErrors": []}], "parseErrors": []}, {"type": "list", "items": [{"type": "text", "value": [{"children": [{"text": "It comes with great costs or benefits. ", "spanType": "span-simple-text"}], "spanType": "span-bold"}, {"text": "The costs or benefits can be direct, and shorten people’s lives or mean they lead happier lives. An example is the ", "spanType": "span-simple-text"}, {"url": "https://ourworldindata.org/coronavirus", "children": [{"text": "COVID-19 pandemic", "spanType": "span-simple-text"}], "spanType": "span-link"}, {"text": ", which has immediately affected people’s well-being. But the costs or benefits can also be indirect, and worsen or alleviate other problems. An examp… | {"errors": [{"name": "unexpected wp component tag", "details": "Found unhandled wp:comment tag list"}, {"name": "unexpected wp component tag", "details": "Found unhandled wp:comment tag list"}, {"name": "unexpected wp component tag", "details": "Found unhandled wp:comment tag list"}, {"name": "unexpected wp component tag", "details": "Found unhandled wp:comment tag list"}, {"name": "unexpected wp component tag", "details": "Found unhandled wp:comment tag list"}, {"name": "unexpected wp component tag", "details": "Found unhandled wp:comment tag list"}, {"name": "unexpected wp component tag", "details": "Found unhandled wp:comment tag list"}, {"name": "unexpected wp component tag", "details": "Found unhandled wp:comment tag list"}, {"name": "unexpected wp component tag", "details": "Found unhandled wp:comment tag list"}], "numBlocks": 11, "numErrors": 9, "wpTagCounts": {"list": 9, "paragraph": 12}, "htmlTagCounts": {"p": 12, "ul": 9}} | 2023-02-27 09:05:08 | 2024-02-16 14:23:03 | [null] | 2023-02-27 09:05:08 | {} | We cover a topic if we believe it helps our readers understand one or several of the world’s largest problems. More specifically, this means that a topic will fit many of the following criteria: * **It affects many countries and people.** This can mean that it concerns every person, such as [health](https://ourworldindata.org/health-meta). It can mean that it affects many people in all countries, such as [poverty](https://ourworldindata.org/poverty). Or it can mean that it affects many people in fewer countries, such as [malaria](https://ourworldindata.org/malaria). * **It comes with great costs or benefits. **The costs or benefits can be direct, and shorten people’s lives or mean they lead happier lives. An example is the [COVID-19 pandemic](https://ourworldindata.org/coronavirus), which has immediately affected people’s well-being. But the costs or benefits can also be indirect, and worsen or alleviate other problems. An example is [agricultural production](https://ourworldindata.org/agricultural-production), which affects many people’s access to nutrition. * **It poses significant risks.** This means that it may not impose great costs at the moment, but may do so in the future. An example is [nuclear weapons](https://ourworldindata.org/nuclear-weapons), which have not been used in decades but whose use would be devastating. * **It will remain important, or become more important in the future.**[Poverty](https://ourworldindata.org/poverty) is an example of a topic that will remain important, as many people remain impoverished even if fewer people live in extreme poverty than in the past. [Artificial intelligence](https://ourworldindata.org/artificial-intelligence) is an example of a topic that will become more important, as technological advances continuously expand its effects on people’s lives. * **It is helpful to understand other topics.** Many of the topics we focus on are problems in themselves. But we also provide data and research on major changes that help us understand and address these problems.… | {"data": {"wpBlock": {"content": "\n<p>We cover a topic if we believe it helps our readers understand one or several of the world’s largest problems. More specifically, this means that a topic will fit many of the following criteria:</p>\n\n\n\n<p></p>\n\n\n\n<ul><li><strong>It affects many countries and people.</strong> This can mean that it concerns every person, such as <a href=\"https://ourworldindata.org/health-meta\">health</a>. It can mean that it affects many people in all countries, such as <a href=\"https://ourworldindata.org/poverty\">poverty</a>. Or it can mean that it affects many people in fewer countries, such as <a href=\"https://ourworldindata.org/malaria\">malaria</a>.</li></ul>\n\n\n\n<p></p>\n\n\n\n<ul><li><strong>It comes with great costs or benefits. </strong>The costs or benefits can be direct, and shorten people’s lives or mean they lead happier lives. An example is the <a href=\"https://ourworldindata.org/coronavirus\">COVID-19 pandemic</a>, which has immediately affected people’s well-being. But the costs or benefits can also be indirect, and worsen or alleviate other problems. An example is <a href=\"https://ourworldindata.org/agricultural-production\">agricultural production</a>, which affects many people’s access to nutrition.</li></ul>\n\n\n\n<p></p>\n\n\n\n<ul><li><strong>It poses significant risks.</strong> This means that it may not impose great costs at the moment, but may do so in the future. An example is <a href=\"https://ourworldindata.org/nuclear-weapons\">nuclear weapons</a>, which have not been used in decades but whose use would be devastating.</li></ul>\n\n\n\n<p></p>\n\n\n\n<ul><li><strong>It will remain important, or become more important in the future.</strong> <a href=\"https://ourworldindata.org/poverty\">Poverty</a> is an example of a topic that will remain important, as many people remain impoverished even if fewer people live in extreme poverty than in the past. <a href=\"https://ourworldindata.org/artificial-intelligence\">Artificial intelligence</a> is an examp… | ||||
| 1186 | 1186 | 56043 | Optimism and Pessimism | optimism-and-pessimism | post | publish | <!-- wp:paragraph -->
<p>This page is dedicated to the research why people are optimistic or pessimistic about certain things and how this is influenced by human nature, the media, and social circumstances.</p>
<!-- /wp:paragraph -->
<!-- wp:paragraph -->
<p>We are interested in this topic also because it is closely linked to <a rel="noopener noreferrer" href="https://ourworldindata.org/about/" target="_blank">our motivation</a> for publishing Our World in Data. We face big global problems, but living conditions around the world have improved in important ways; fewer people are dying of disease, conflict and famine; more of us are receiving a basic education; the world is becoming more democratic; we live longer and lead healthier lives. </p>
<!-- /wp:paragraph -->
<!-- wp:paragraph -->
<p>Why is that we – especially those in the developed world – often have a negative view on how the world has changed over the last decades and centuries? Why we are so pessimistic about our collective future?</p>
<!-- /wp:paragraph -->
<!-- wp:heading -->
<h2>Human nature and pessimism</h2>
<!-- /wp:heading -->
<!-- wp:heading {"level":3} -->
<h3>Individual optimism and social pessimism</h3>
<!-- /wp:heading -->
<!-- wp:paragraph -->
<p>It is a peculiar empirical phenomenon that while people tend to be optimistic about their own future, they can at the same time be deeply pessimistic about the future of their nation or the world. Tali Sharot, associate professor of psychology at UCL, has popularised the idea of an innate optimism bias built into the human brain.{ref}Sharot, Tali. <em>The Optimism Bias: A Tour of the Irrationally Positive Brain</em>. New York: Pantheon Books, 2011.<br><br>Sharot, Tali. <em>The Science of Optimism Why We're Hard-wired for Hope</em>. New York: Ted Conferences, 2012.{/ref}</p>
<!-- /wp:paragraph -->
<!-- wp:paragraph -->
<p> That is, we tend to be optimistic rather than realistic when considering our individual future. If you were to ask newlywed couples to estimate the prob… |
{"id": "wp-56043", "slug": "optimism-and-pessimism", "content": {"toc": [], "body": [{"type": "text", "value": [{"text": "This page is dedicated to the research why people are optimistic or pessimistic about certain things and how this is influenced by human nature, the media, and social circumstances.", "spanType": "span-simple-text"}], "parseErrors": []}, {"type": "text", "value": [{"text": "We are interested in this topic also because it is closely linked to ", "spanType": "span-simple-text"}, {"url": "https://ourworldindata.org/about/", "children": [{"text": "our motivation", "spanType": "span-simple-text"}], "spanType": "span-link"}, {"text": " for publishing Our World in Data. We face big global problems, but living conditions around the world have improved in important ways; fewer people are dying of disease, conflict and famine; more of us are receiving a basic education; the world is becoming more democratic; we live longer and lead healthier lives. ", "spanType": "span-simple-text"}], "parseErrors": []}, {"type": "text", "value": [{"text": "Why is that we – especially those in the developed world – often have a negative view on how the world has changed over the last decades and centuries? Why we are so pessimistic about our collective future?", "spanType": "span-simple-text"}], "parseErrors": []}, {"text": [{"text": "Human nature and pessimism", "spanType": "span-simple-text"}], "type": "heading", "level": 2, "parseErrors": []}, {"text": [{"text": "Individual optimism and social pessimism", "spanType": "span-simple-text"}], "type": "heading", "level": 3, "parseErrors": []}, {"type": "text", "value": [{"text": "It is a peculiar empirical phenomenon that while people tend to be optimistic about their own future, they can at the same time be deeply pessimistic about the future of their nation or the world. Tali Sharot, associate professor of psychology at UCL, has popularised the idea of an innate optimism bias built into the human brain.{ref}Sharot, Tali. ", "spanType": "span-simple-text"}, {"children": … | {"errors": [{"name": "unexpected wp component tag", "details": "Found unhandled wp:comment tag image"}, {"name": "unexpected wp component tag", "details": "Found unhandled wp:comment tag image"}, {"name": "unexpected wp component tag", "details": "Found unhandled wp:comment tag image"}, {"name": "unexpected wp component tag", "details": "Found unhandled wp:comment tag list"}, {"name": "unexpected wp component tag", "details": "Found unhandled wp:comment tag quote"}, {"name": "unexpected wp component tag", "details": "Found unhandled wp:comment tag image"}, {"name": "unexpected wp component tag", "details": "Found unhandled wp:comment tag image"}, {"name": "unexpected wp component tag", "details": "Found unhandled wp:comment tag image"}, {"name": "unexpected wp component tag", "details": "Found unhandled wp:comment tag image"}, {"name": "unexpected wp component tag", "details": "Found unhandled wp:comment tag image"}, {"name": "unexpected wp component tag", "details": "Found unhandled wp:comment tag image"}, {"name": "unexpected wp component tag", "details": "Found unhandled wp:comment tag image"}, {"name": "unexpected wp component tag", "details": "Found unhandled wp:comment tag list"}, {"name": "unexpected wp component tag", "details": "Found unhandled wp:comment tag image"}, {"name": "unexpected wp component tag", "details": "Found unhandled wp:comment tag image"}, {"name": "unexpected wp component tag", "details": "Found unhandled wp:comment tag image"}, {"name": "unexpected wp component tag", "details": "Found unhandled wp:comment tag image"}], "numBlocks": 113, "numErrors": 17, "wpTagCounts": {"list": 2, "image": 14, "quote": 1, "heading": 33, "paragraph": 63}, "htmlTagCounts": {"p": 64, "h2": 3, "h3": 8, "h4": 13, "h6": 9, "ol": 2, "div": 14, "figure": 14, "blockquote": 1}} | 2023-02-23 14:58:08 | 2024-02-16 14:22:54 | 1Lo3CtGGESA3iQVrlhlQZbtG15ecUNt1Qfk2X3iBlwIk | ["Hannah Ritchie"] | 2023-02-23 14:58:08 | 2023-02-23 14:59:23 | {} | This page is dedicated to the research why people are optimistic or pessimistic about certain things and how this is influenced by human nature, the media, and social circumstances. We are interested in this topic also because it is closely linked to [our motivation](https://ourworldindata.org/about/) for publishing Our World in Data. We face big global problems, but living conditions around the world have improved in important ways; fewer people are dying of disease, conflict and famine; more of us are receiving a basic education; the world is becoming more democratic; we live longer and lead healthier lives. Why is that we – especially those in the developed world – often have a negative view on how the world has changed over the last decades and centuries? Why we are so pessimistic about our collective future? ## Human nature and pessimism ### Individual optimism and social pessimism It is a peculiar empirical phenomenon that while people tend to be optimistic about their own future, they can at the same time be deeply pessimistic about the future of their nation or the world. Tali Sharot, associate professor of psychology at UCL, has popularised the idea of an innate optimism bias built into the human brain.{ref}Sharot, Tali. _The Optimism Bias: A Tour of the Irrationally Positive Brain_. New York: Pantheon Books, 2011. Sharot, Tali. _The Science of Optimism Why We're Hard-wired for Hope_. New York: Ted Conferences, 2012.{/ref} That is, we tend to be optimistic rather than realistic when considering our individual future. If you were to ask newlywed couples to estimate the probability they will divorce in the future, they would likely reject the possibility outright. Yet today roughly 40% of marriages in the UK end in divorce. Another example is asking smokers to estimate their chances of getting cancer and again, most would underestimate their risk. This optimism persists even when people are presented with the relevant statistics. Consider the following graphs from the European Union's Eurobar… | {"id": 56043, "date": "2023-02-23T14:58:08", "guid": {"rendered": "https://owid.cloud/?p=56043"}, "link": "https://owid.cloud/optimism-and-pessimism", "meta": {"owid_publication_context_meta_field": []}, "slug": "optimism-and-pessimism", "tags": [], "type": "post", "title": {"rendered": "Optimism and Pessimism"}, "_links": {"self": [{"href": "https://owid.cloud/wp-json/wp/v2/posts/56043"}], "about": [{"href": "https://owid.cloud/wp-json/wp/v2/types/post"}], "author": [{"href": "https://owid.cloud/wp-json/wp/v2/users/17", "embeddable": true}], "curies": [{"href": "https://api.w.org/{rel}", "name": "wp", "templated": true}], "replies": [{"href": "https://owid.cloud/wp-json/wp/v2/comments?post=56043", "embeddable": true}], "wp:term": [{"href": "https://owid.cloud/wp-json/wp/v2/categories?post=56043", "taxonomy": "category", "embeddable": true}, {"href": "https://owid.cloud/wp-json/wp/v2/tags?post=56043", "taxonomy": "post_tag", "embeddable": true}], "collection": [{"href": "https://owid.cloud/wp-json/wp/v2/posts"}], "wp:attachment": [{"href": "https://owid.cloud/wp-json/wp/v2/media?parent=56043"}], "version-history": [{"href": "https://owid.cloud/wp-json/wp/v2/posts/56043/revisions", "count": 1}], "predecessor-version": [{"id": 56044, "href": "https://owid.cloud/wp-json/wp/v2/posts/56043/revisions/56044"}]}, "author": 17, "format": "standard", "status": "publish", "sticky": false, "content": {"rendered": "\n<p>This page is dedicated to the research why people are optimistic or pessimistic about certain things and how this is influenced by human nature, the media, and social circumstances.</p>\n\n\n\n<p>We are interested in this topic also because it is closely linked to <a rel=\"noopener noreferrer\" href=\"https://ourworldindata.org/about/\" target=\"_blank\">our motivation</a> for publishing Our World in Data. We face big global problems, but living conditions around the world have improved in important ways; fewer people are dying of disease, conflict and famine; more of us are receiving a basic educati… | ||
| 1185 | 1185 | 56037 | Waste Management | waste-management | page | publish | <!-- wp:paragraph --> <p>Now in GDoc: https://owid.cloud/admin/gdocs/1Ame1LHwda2O45NasOLFDDbWY3HWaTAToB0FbmYdLVwI/preview</p> <!-- /wp:paragraph --> |
{"id": "wp-56037", "slug": "waste-management", "content": {"toc": [], "body": [{"type": "text", "value": [{"text": "Now in GDoc: https://owid.cloud/admin/gdocs/1Ame1LHwda2O45NasOLFDDbWY3HWaTAToB0FbmYdLVwI/preview", "spanType": "span-simple-text"}], "parseErrors": []}], "type": "article", "title": "Waste Management", "authors": ["Hannah Ritchie", "Edouard Mathieu"], "dateline": "February 23, 2023", "sidebar-toc": false, "featured-image": "Waste-Management.png"}, "createdAt": "2023-02-23T14:46:08.000Z", "published": false, "updatedAt": "2023-08-11T14:20:14.000Z", "revisionId": null, "publishedAt": "2023-02-23T14:46:28.000Z", "relatedCharts": [], "publicationContext": "listed"} | {"errors": [], "numBlocks": 1, "numErrors": 0, "wpTagCounts": {"paragraph": 1}, "htmlTagCounts": {"p": 1}} | 2023-02-23 14:46:28 | 2024-02-16 14:22:42 | ["Hannah Ritchie", "Edouard Mathieu"] | 2023-02-23 14:46:08 | 2023-08-11 14:20:14 | https://ourworldindata.org/wp-content/uploads/2023/02/Waste-Management.png | {} | Now in GDoc: https://owid.cloud/admin/gdocs/1Ame1LHwda2O45NasOLFDDbWY3HWaTAToB0FbmYdLVwI/preview | {"id": 56037, "date": "2023-02-23T14:46:28", "guid": {"rendered": "https://owid.cloud/?page_id=56037"}, "link": "https://owid.cloud/waste-management", "meta": {"owid_publication_context_meta_field": [], "owid_key_performance_indicators_meta_field": []}, "slug": "waste-management", "tags": [], "type": "page", "title": {"rendered": "Waste Management"}, "_links": {"self": [{"href": "https://owid.cloud/wp-json/wp/v2/pages/56037"}], "about": [{"href": "https://owid.cloud/wp-json/wp/v2/types/page"}], "author": [{"href": "https://owid.cloud/wp-json/wp/v2/users/17", "embeddable": true}], "curies": [{"href": "https://api.w.org/{rel}", "name": "wp", "templated": true}], "replies": [{"href": "https://owid.cloud/wp-json/wp/v2/comments?post=56037", "embeddable": true}], "wp:term": [{"href": "https://owid.cloud/wp-json/wp/v2/categories?post=56037", "taxonomy": "category", "embeddable": true}, {"href": "https://owid.cloud/wp-json/wp/v2/tags?post=56037", "taxonomy": "post_tag", "embeddable": true}], "collection": [{"href": "https://owid.cloud/wp-json/wp/v2/pages"}], "wp:attachment": [{"href": "https://owid.cloud/wp-json/wp/v2/media?parent=56037"}], "version-history": [{"href": "https://owid.cloud/wp-json/wp/v2/pages/56037/revisions", "count": 3}], "wp:featuredmedia": [{"href": "https://owid.cloud/wp-json/wp/v2/media/56040", "embeddable": true}], "predecessor-version": [{"id": 57975, "href": "https://owid.cloud/wp-json/wp/v2/pages/56037/revisions/57975"}]}, "author": 17, "parent": 0, "status": "publish", "content": {"rendered": "\n<p>Now in GDoc: https://owid.cloud/admin/gdocs/1Ame1LHwda2O45NasOLFDDbWY3HWaTAToB0FbmYdLVwI/preview</p>\n", "protected": false}, "excerpt": {"rendered": "", "protected": false}, "date_gmt": "2023-02-23T14:46:28", "modified": "2023-08-11T15:20:14", "template": "", "categories": [], "menu_order": 20, "ping_status": "closed", "authors_name": ["Hannah Ritchie", "Edouard Mathieu"], "modified_gmt": "2023-08-11T14:20:14", "comment_status": "closed", "featured_media": 56040, "featured_media_paths": {"thumbnail"… | ||
| 1184 | 1184 | 56007 | How we choose which topics to work on, and which metrics to provide | choosing-our-topics-and-metrics | post | publish | <!-- wp:paragraph -->
<p>On <em>Our World in Data</em>, we present thousands of metrics on hundreds of topics.</p>
<!-- /wp:paragraph -->
<!-- wp:paragraph -->
<p>But there are many more topics that we could work on, and metrics we could present. How do we choose them?</p>
<!-- /wp:paragraph -->
<!-- wp:paragraph -->
<p></p>
<!-- /wp:paragraph -->
<!-- wp:heading {"level":4} -->
<h4>How do we choose which topics to cover?</h4>
<!-- /wp:heading -->
<!-- wp:paragraph -->
<p>We cover a topic if we believe it helps our readers understand one or several of the world’s largest problems. More specifically, this means that a topic will fit many of the following criteria:</p>
<!-- /wp:paragraph -->
<!-- wp:paragraph -->
<p></p>
<!-- /wp:paragraph -->
<!-- wp:list -->
<ul><li><strong>It affects many countries and people.</strong> This can mean that it concerns every person, such as <a href="https://ourworldindata.org/health-meta">health</a>. It can mean that it affects many people in all countries, such as <a href="https://ourworldindata.org/poverty">poverty</a>. Or it can mean that it affects many people in fewer countries, such as <a href="https://ourworldindata.org/malaria">malaria</a>.</li></ul>
<!-- /wp:list -->
<!-- wp:paragraph -->
<p></p>
<!-- /wp:paragraph -->
<!-- wp:list -->
<ul><li><strong>It comes with great costs or benefits. </strong>The costs or benefits can be direct, and shorten people’s lives or mean they lead happier lives. An example is the <a href="https://ourworldindata.org/coronavirus">COVID-19 pandemic</a>, which has immediately affected people’s well-being. But the costs or benefits can also be indirect, and worsen or alleviate other problems. An example is <a href="https://ourworldindata.org/agricultural-production">agricultural production</a>, which affects many people’s access to nutrition.</li></ul>
<!-- /wp:list -->
<!-- wp:paragraph -->
<p></p>
<!-- /wp:paragraph -->
<!-- wp:list -->
<ul><li><strong>It poses significant risks.</strong> This means that it may not impose great costs … |
{"id": "wp-56007", "slug": "choosing-our-topics-and-metrics", "content": {"toc": [], "body": [{"type": "text", "value": [{"text": "On ", "spanType": "span-simple-text"}, {"children": [{"text": "Our World in Data", "spanType": "span-simple-text"}], "spanType": "span-italic"}, {"text": ", we present thousands of metrics on hundreds of topics.", "spanType": "span-simple-text"}], "parseErrors": []}, {"type": "text", "value": [{"text": "But there are many more topics that we could work on, and metrics we could present. How do we choose them?", "spanType": "span-simple-text"}], "parseErrors": []}, {"text": [{"text": "How do we choose which topics to cover?", "spanType": "span-simple-text"}], "type": "heading", "level": 2, "parseErrors": []}, {"type": "text", "value": [{"text": "We cover a topic if we believe it helps our readers understand one or several of the world’s largest problems. More specifically, this means that a topic will fit many of the following criteria:", "spanType": "span-simple-text"}], "parseErrors": []}, {"type": "list", "items": [{"type": "text", "value": [{"children": [{"text": "It affects many countries and people.", "spanType": "span-simple-text"}], "spanType": "span-bold"}, {"text": " This can mean that it concerns every person, such as ", "spanType": "span-simple-text"}, {"url": "https://ourworldindata.org/health-meta", "children": [{"text": "health", "spanType": "span-simple-text"}], "spanType": "span-link"}, {"text": ". It can mean that it affects many people in all countries, such as ", "spanType": "span-simple-text"}, {"url": "https://ourworldindata.org/poverty", "children": [{"text": "poverty", "spanType": "span-simple-text"}], "spanType": "span-link"}, {"text": ". Or it can mean that it affects many people in fewer countries, such as ", "spanType": "span-simple-text"}, {"url": "https://ourworldindata.org/malaria", "children": [{"text": "malaria", "spanType": "span-simple-text"}], "spanType": "span-link"}, {"text": ".", "spanType": "span-simple-text"}], "parseErrors": []}], "parseErrors":… | {"errors": [{"name": "unexpected wp component tag", "details": "Found unhandled wp:comment tag list"}, {"name": "unexpected wp component tag", "details": "Found unhandled wp:comment tag list"}, {"name": "unexpected wp component tag", "details": "Found unhandled wp:comment tag list"}, {"name": "unexpected wp component tag", "details": "Found unhandled wp:comment tag list"}, {"name": "unexpected wp component tag", "details": "Found unhandled wp:comment tag list"}, {"name": "unexpected wp component tag", "details": "Found unhandled wp:comment tag list"}, {"name": "unexpected wp component tag", "details": "Found unhandled wp:comment tag list"}, {"name": "unexpected wp component tag", "details": "Found unhandled wp:comment tag list"}, {"name": "unexpected wp component tag", "details": "Found unhandled wp:comment tag list"}, {"name": "unexpected wp component tag", "details": "Found unhandled wp:comment tag list"}, {"name": "unexpected wp component tag", "details": "Found unhandled wp:comment tag list"}, {"name": "unexpected wp component tag", "details": "Found unhandled wp:comment tag list"}, {"name": "unexpected wp component tag", "details": "Found unhandled wp:comment tag list"}, {"name": "unexpected wp component tag", "details": "Found unhandled wp:comment tag list"}, {"name": "unexpected wp component tag", "details": "Found unhandled wp:comment tag list"}, {"name": "unexpected wp component tag", "details": "Found unhandled wp:comment tag list"}, {"name": "unexpected wp component tag", "details": "Found unhandled wp:comment tag list"}, {"name": "unexpected wp component tag", "details": "Found unhandled wp:comment tag list"}, {"name": "unexpected wp component tag", "details": "Found unhandled wp:comment tag list"}, {"name": "unexpected wp component tag", "details": "Found unhandled wp:comment tag list"}], "numBlocks": 30, "numErrors": 20, "wpTagCounts": {"list": 20, "heading": 3, "paragraph": 31}, "htmlTagCounts": {"p": 31, "h4": 3, "ul": 20}} | 2023-02-27 08:30:01 | 2024-02-16 14:22:54 | 1KKAs2S3PBqQLeDtaC-QrSGT0IzewyNF7DyGToEIIb1M | ["Bastian Herre"] | On Our World in Data, we present thousands of metrics on hundreds of topics. How do we choose them? | 2023-02-22 13:16:34 | 2023-07-10 16:46:10 | https://ourworldindata.org/wp-content/uploads/2016/06/OurWorldInData.png | {} | On _Our World in Data_, we present thousands of metrics on hundreds of topics. But there are many more topics that we could work on, and metrics we could present. How do we choose them? ## How do we choose which topics to cover? We cover a topic if we believe it helps our readers understand one or several of the world’s largest problems. More specifically, this means that a topic will fit many of the following criteria: * **It affects many countries and people.** This can mean that it concerns every person, such as [health](https://ourworldindata.org/health-meta). It can mean that it affects many people in all countries, such as [poverty](https://ourworldindata.org/poverty). Or it can mean that it affects many people in fewer countries, such as [malaria](https://ourworldindata.org/malaria). * **It comes with great costs or benefits. **The costs or benefits can be direct, and shorten people’s lives or mean they lead happier lives. An example is the [COVID-19 pandemic](https://ourworldindata.org/coronavirus), which has immediately affected people’s well-being. But the costs or benefits can also be indirect, and worsen or alleviate other problems. An example is [agricultural production](https://ourworldindata.org/agricultural-production), which affects many people’s access to nutrition. * **It poses significant risks.** This means that it may not impose great costs at the moment, but may do so in the future. An example is [nuclear weapons](https://ourworldindata.org/nuclear-weapons), which have not been used in decades but whose use would be devastating. * **It will remain important, or become more important in the future.**[Poverty](https://ourworldindata.org/poverty) is an example of a topic that will remain important, as many people remain impoverished even if fewer people live in extreme poverty than in the past. [Artificial intelligence](https://ourworldindata.org/artificial-intelligence) is an example of a topic that will become more important, as technological advances continuously expand its effects o… | {"id": 56007, "date": "2023-02-27T08:30:01", "guid": {"rendered": "https://owid.cloud/?p=56007"}, "link": "https://owid.cloud/choosing-our-topics-and-metrics", "meta": {"owid_publication_context_meta_field": {"latest": true, "homepage": true, "immediate_newsletter": true}}, "slug": "choosing-our-topics-and-metrics", "tags": [], "type": "post", "title": {"rendered": "How we choose which topics to work on, and which metrics to provide"}, "_links": {"self": [{"href": "https://owid.cloud/wp-json/wp/v2/posts/56007"}], "about": [{"href": "https://owid.cloud/wp-json/wp/v2/types/post"}], "author": [{"href": "https://owid.cloud/wp-json/wp/v2/users/49", "embeddable": true}], "curies": [{"href": "https://api.w.org/{rel}", "name": "wp", "templated": true}], "replies": [{"href": "https://owid.cloud/wp-json/wp/v2/comments?post=56007", "embeddable": true}], "wp:term": [{"href": "https://owid.cloud/wp-json/wp/v2/categories?post=56007", "taxonomy": "category", "embeddable": true}, {"href": "https://owid.cloud/wp-json/wp/v2/tags?post=56007", "taxonomy": "post_tag", "embeddable": true}], "collection": [{"href": "https://owid.cloud/wp-json/wp/v2/posts"}], "wp:attachment": [{"href": "https://owid.cloud/wp-json/wp/v2/media?parent=56007"}], "version-history": [{"href": "https://owid.cloud/wp-json/wp/v2/posts/56007/revisions", "count": 24}], "wp:featuredmedia": [{"href": "https://owid.cloud/wp-json/wp/v2/media/8771", "embeddable": true}], "predecessor-version": [{"id": 56078, "href": "https://owid.cloud/wp-json/wp/v2/posts/56007/revisions/56078"}]}, "author": 49, "format": "standard", "status": "publish", "sticky": false, "content": {"rendered": "\n<p>On <em>Our World in Data</em>, we present thousands of metrics on hundreds of topics.</p>\n\n\n\n<p>But there are many more topics that we could work on, and metrics we could present. How do we choose them?</p>\n\n\n\n<p></p>\n\n\n\n<h4>How do we choose which topics to cover?</h4>\n\n\n\n<p>We cover a topic if we believe it helps our readers understand one or several of the world’s largest… |
| 1183 | 1183 | 55967 | What does it mean for a species to be at risk of extinction? | extinction-risk-definition | post | publish | <!-- wp:paragraph -->
<p>The International Union for Conservation of Nature (IUCN) reports that tens of thousands of species are <a href="https://ourworldindata.org/grapher/number-species-threatened">threatened with extinction</a>.</p>
<!-- /wp:paragraph -->
<!-- wp:paragraph -->
<p>But what does it mean for a species to be ‘threatened with extinction’? How do researchers evaluate extinction risk?</p>
<!-- /wp:paragraph -->
<!-- wp:paragraph -->
<p>The <a href="https://www.iucnredlist.org/">IUCN <em>Red List of Threatened Species</em></a> is regarded as the definitive source of extinction risk. Every year, the IUCN publishes its latest assessment of the status of each evaluated species.</p>
<!-- /wp:paragraph -->
<!-- wp:paragraph -->
<p>In this article, we look at how species are categorized and assessed for their extinction risk.</p>
<!-- /wp:paragraph -->
<!-- wp:heading {"level":3} -->
<h3>The 9 categories of extinction risk</h3>
<!-- /wp:heading -->
<!-- wp:columns -->
<div class="wp-block-columns"><!-- wp:column -->
<div class="wp-block-column"><!-- wp:paragraph -->
<p>Each species is assessed against a standardized list of criteria.{ref}Here we use the term ‘species’ to talk about different groups of organisms. This is the main level that wildlife is evaluated for extinction risk. But, the IUCN also uses the broader term ‘taxon’ which applies at the species level or sub-species level. This means that the framework can be applied to evaluate extinction risk at multiple levels.{/ref} Based on these answers, a species is assigned to one of <strong>nine categories</strong>:</p>
<!-- /wp:paragraph -->
<!-- wp:list -->
<ul><li>Not Evaluated (NE)</li><li>Data Deficient (DD)</li><li>Least Concern (LC)</li><li>Near Threatened (NT)</li><li>Vulnerable (VU)</li><li>Endangered (EN)</li><li>Critically Endangered (CR)</li><li>Extinct in the Wild (EW)</li><li>Extinct (EX)<br></li></ul>
<!-- /wp:list -->
<!-- wp:paragraph -->
<p>How these categories relate to each other is shown in the visualization.</p>
<!-- /wp:pa… |
{"id": "wp-55967", "slug": "extinction-risk-definition", "content": {"toc": [], "body": [{"type": "text", "value": [{"text": "The International Union for Conservation of Nature (IUCN) reports that tens of thousands of species are ", "spanType": "span-simple-text"}, {"url": "https://ourworldindata.org/grapher/number-species-threatened", "children": [{"text": "threatened with extinction", "spanType": "span-simple-text"}], "spanType": "span-link"}, {"text": ".", "spanType": "span-simple-text"}], "parseErrors": []}, {"type": "text", "value": [{"text": "But what does it mean for a species to be ‘threatened with extinction’? How do researchers evaluate extinction risk?", "spanType": "span-simple-text"}], "parseErrors": []}, {"type": "text", "value": [{"text": "The ", "spanType": "span-simple-text"}, {"url": "https://www.iucnredlist.org/", "children": [{"text": "IUCN ", "spanType": "span-simple-text"}, {"children": [{"text": "Red List of Threatened Species", "spanType": "span-simple-text"}], "spanType": "span-italic"}], "spanType": "span-link"}, {"text": " is regarded as the definitive source of extinction risk. Every year, the IUCN publishes its latest assessment of the status of each evaluated species.", "spanType": "span-simple-text"}], "parseErrors": []}, {"type": "text", "value": [{"text": "In this article, we look at how species are categorized and assessed for their extinction risk.", "spanType": "span-simple-text"}], "parseErrors": []}, {"text": [{"text": "The 9 categories of extinction risk", "spanType": "span-simple-text"}], "type": "heading", "level": 2, "parseErrors": []}, {"left": [{"type": "text", "value": [{"text": "Each species is assessed against a standardized list of criteria.{ref}Here we use the term ‘species’ to talk about different groups of organisms. This is the main level that wildlife is evaluated for extinction risk. But, the IUCN also uses the broader term ‘taxon’ which applies at the species level or sub-species level. This means that the framework can be applied to evaluate extinction risk … | {"errors": [{"name": "unexpected wp component tag", "details": "Found unhandled wp:comment tag list"}, {"name": "unhandled html tag found", "details": "Encountered the unhandled tag hr"}, {"name": "unexpected wp component tag", "details": "Found unhandled wp:comment tag separator"}, {"name": "unhandled html tag found", "details": "Encountered the unhandled tag hr"}, {"name": "unexpected wp component tag", "details": "Found unhandled wp:comment tag separator"}, {"name": "unexpected wp component tag", "details": "Found unhandled wp:comment tag image"}, {"name": "unexpected wp component tag", "details": "Found unhandled wp:comment tag list"}], "numBlocks": 23, "numErrors": 7, "wpTagCounts": {"list": 2, "image": 1, "column": 2, "columns": 1, "heading": 3, "paragraph": 36, "separator": 2}, "htmlTagCounts": {"p": 36, "h3": 3, "hr": 2, "ol": 1, "ul": 1, "div": 3, "figure": 1}} | 2023-02-20 10:56:33 | 2024-03-10 13:14:25 | 14SGOgwH7D0N51LGCXHhHMnRR1FbZqEfTNI98ipiRmrk | ["Hannah Ritchie"] | We need to focus on the most threatened species to protect them from extinction. But what does it mean for a species to be at risk, and how is it measured? | 2023-02-20 10:56:33 | 2023-07-10 16:16:20 | https://ourworldindata.org/wp-content/uploads/2023/02/IUCN-Thumbnail-01.png | {} | The International Union for Conservation of Nature (IUCN) reports that tens of thousands of species are [threatened with extinction](https://ourworldindata.org/grapher/number-species-threatened). But what does it mean for a species to be ‘threatened with extinction’? How do researchers evaluate extinction risk? The [IUCN _Red List of Threatened Species_](https://www.iucnredlist.org/) is regarded as the definitive source of extinction risk. Every year, the IUCN publishes its latest assessment of the status of each evaluated species. In this article, we look at how species are categorized and assessed for their extinction risk. ## The 9 categories of extinction risk Each species is assessed against a standardized list of criteria.{ref}Here we use the term ‘species’ to talk about different groups of organisms. This is the main level that wildlife is evaluated for extinction risk. But, the IUCN also uses the broader term ‘taxon’ which applies at the species level or sub-species level. This means that the framework can be applied to evaluate extinction risk at multiple levels.{/ref} Based on these answers, a species is assigned to one of **nine categories**: * Not Evaluated (NE) * Data Deficient (DD) * Least Concern (LC) * Near Threatened (NT) * Vulnerable (VU) * Endangered (EN) * Critically Endangered (CR) * Extinct in the Wild (EW) * Extinct (EX) How these categories relate to each other is shown in the visualization. The first two categories are about species that we can’t say much about. **Not Evaluated (NE). **The first question researchers ask is whether we know enough about a species to evaluate their status. If a species doesn’t meet this criterion, they are not evaluated and removed from the assessment process. As part of the IUCN’s aims, each species is re-evaluated every five to ten years; if our understanding has developed by this point, then a species can be evaluated later. **Data Deficient (DD).** For some species, we do not have sufficient data to assess their risk of extinction. We might … | {"id": 55967, "date": "2023-02-20T10:56:33", "guid": {"rendered": "https://owid.cloud/?p=55967"}, "link": "https://owid.cloud/extinction-risk-definition", "meta": {"owid_publication_context_meta_field": {"latest": true, "homepage": true, "immediate_newsletter": true}}, "slug": "extinction-risk-definition", "tags": [], "type": "post", "title": {"rendered": "What does it mean for a species to be at risk of extinction?"}, "_links": {"self": [{"href": "https://owid.cloud/wp-json/wp/v2/posts/55967"}], "about": [{"href": "https://owid.cloud/wp-json/wp/v2/types/post"}], "author": [{"href": "https://owid.cloud/wp-json/wp/v2/users/17", "embeddable": true}], "curies": [{"href": "https://api.w.org/{rel}", "name": "wp", "templated": true}], "replies": [{"href": "https://owid.cloud/wp-json/wp/v2/comments?post=55967", "embeddable": true}], "wp:term": [{"href": "https://owid.cloud/wp-json/wp/v2/categories?post=55967", "taxonomy": "category", "embeddable": true}, {"href": "https://owid.cloud/wp-json/wp/v2/tags?post=55967", "taxonomy": "post_tag", "embeddable": true}], "collection": [{"href": "https://owid.cloud/wp-json/wp/v2/posts"}], "wp:attachment": [{"href": "https://owid.cloud/wp-json/wp/v2/media?parent=55967"}], "version-history": [{"href": "https://owid.cloud/wp-json/wp/v2/posts/55967/revisions", "count": 3}], "wp:featuredmedia": [{"href": "https://owid.cloud/wp-json/wp/v2/media/55972", "embeddable": true}], "predecessor-version": [{"id": 56036, "href": "https://owid.cloud/wp-json/wp/v2/posts/55967/revisions/56036"}]}, "author": 17, "format": "standard", "status": "publish", "sticky": false, "content": {"rendered": "\n<p>The International Union for Conservation of Nature (IUCN) reports that tens of thousands of species are <a href=\"https://ourworldindata.org/grapher/number-species-threatened\">threatened with extinction</a>.</p>\n\n\n\n<p>But what does it mean for a species to be ‘threatened with extinction’? How do researchers evaluate extinction risk?</p>\n\n\n\n<p>The <a href=\"https://www.iucnredlist.org/\">IUCN <em>R… |
| 1177 | 1177 | 55521 | Engel's Law: Richer people spend more money on food, but it makes up a smaller share of their income | engels-law-food-spending | post | publish | <!-- wp:columns -->
<div class="wp-block-columns"><!-- wp:column -->
<div class="wp-block-column"><!-- wp:paragraph -->
<p>Richer people tend to spend more money on food.</p>
<!-- /wp:paragraph -->
<!-- wp:paragraph -->
<p>We see this relationship when we look at data on food expenditure from across the world.</p>
<!-- /wp:paragraph -->
<!-- wp:paragraph -->
<p>In the chart you see food expenditure plotted against total consumer expenditure per person. Total consumer expenditure is any personal expenditure on goods and services.</p>
<!-- /wp:paragraph -->
<!-- wp:paragraph -->
<p>On the y-axis, we have the average amount of money spent on food per person, in countries across the world.{ref}This data comes from the United States Department of Agriculture (USDA) Economic Research Service, which estimates this for countries where available market data is sufficient.{/ref} This measures money spent on food consumed at home – from stores and supermarkets. The source <em>does not </em>include food eaten out-of-home, from restaurants and cafes (however, that would be useful data to have). Tobacco and alcoholic beverages are also excluded.</p>
<!-- /wp:paragraph -->
<!-- wp:paragraph -->
<p>On the x-axis, we have a measure of prosperity, total expenditure. Expenditure tells us how much disposable income people have to spend on goods and services such as food, housing, education, health, and leisure activities. It’s important to ensure that we can afford all of the essentials that give us a high and comfortable standard of living.</p>
<!-- /wp:paragraph -->
<!-- wp:paragraph -->
<p>Countries which are poor – and where therefore people’s expenditure is very low – can be found, richer countries are further towards the right. This is shown on a log axis by default, but you can change it to a linear scale on the interactive chart.</p>
<!-- /wp:paragraph -->
<!-- wp:paragraph -->
<p>Both metrics are measured in US dollars per person per year.</p>
<!-- /wp:paragraph -->
<!-- wp:paragraph -->
<p>What we see is a strong po… |
{"id": "wp-55521", "slug": "engels-law-food-spending", "content": {"toc": [], "body": [{"left": [{"type": "text", "value": [{"text": "Richer people tend to spend more money on food.", "spanType": "span-simple-text"}], "parseErrors": []}, {"type": "text", "value": [{"text": "We see this relationship when we look at data on food expenditure from across the world.", "spanType": "span-simple-text"}], "parseErrors": []}, {"type": "text", "value": [{"text": "In the chart you see food expenditure plotted against total consumer expenditure per person. Total consumer expenditure is any personal expenditure on goods and services.", "spanType": "span-simple-text"}], "parseErrors": []}, {"type": "text", "value": [{"text": "On the y-axis, we have the average amount of money spent on food per person, in countries across the world.{ref}This data comes from the United States Department of Agriculture (USDA) Economic Research Service, which estimates this for countries where available market data is sufficient.{/ref} This measures money spent on food consumed at home – from stores and supermarkets. The source ", "spanType": "span-simple-text"}, {"children": [{"text": "does not ", "spanType": "span-simple-text"}], "spanType": "span-italic"}, {"text": "include food eaten out-of-home, from restaurants and cafes (however, that would be useful data to have). Tobacco and alcoholic beverages are also excluded.", "spanType": "span-simple-text"}], "parseErrors": []}, {"type": "text", "value": [{"text": "On the x-axis, we have a measure of prosperity, total expenditure. Expenditure tells us how much disposable income people have to spend on goods and services such as food, housing, education, health, and leisure activities. It’s important to ensure that we can afford all of the essentials that give us a high and comfortable standard of living.", "spanType": "span-simple-text"}], "parseErrors": []}, {"type": "text", "value": [{"text": "Countries which are poor – and where therefore people’s expenditure is very low – can be found, richer cou… | {"errors": [{"name": "unexpected wp component tag", "details": "Found unhandled wp:comment tag image"}, {"name": "unhandled html tag found", "details": "Encountered the unhandled tag hr"}, {"name": "unexpected wp component tag", "details": "Found unhandled wp:comment tag separator"}], "numBlocks": 9, "numErrors": 3, "wpTagCounts": {"html": 2, "image": 1, "column": 6, "columns": 3, "heading": 3, "paragraph": 22, "separator": 1, "owid/prominent-link": 2}, "htmlTagCounts": {"p": 22, "h3": 2, "h5": 1, "hr": 1, "div": 9, "figure": 1, "iframe": 2}} | 2023-01-19 11:43:15 | 2024-02-16 14:22:54 | 1cA7lv3ROTMuTWV48zIkIx21_C3MD-qbH7UGntiCDK6g | ["Hannah Ritchie"] | How does spending on food change as incomes rise? | 2023-01-19 11:43:15 | 2023-07-10 15:14:46 | https://ourworldindata.org/wp-content/uploads/2023/01/Engels-Law-Featured-Image-01.png | {} | Richer people tend to spend more money on food. We see this relationship when we look at data on food expenditure from across the world. In the chart you see food expenditure plotted against total consumer expenditure per person. Total consumer expenditure is any personal expenditure on goods and services. On the y-axis, we have the average amount of money spent on food per person, in countries across the world.{ref}This data comes from the United States Department of Agriculture (USDA) Economic Research Service, which estimates this for countries where available market data is sufficient.{/ref} This measures money spent on food consumed at home – from stores and supermarkets. The source _does not _include food eaten out-of-home, from restaurants and cafes (however, that would be useful data to have). Tobacco and alcoholic beverages are also excluded. On the x-axis, we have a measure of prosperity, total expenditure. Expenditure tells us how much disposable income people have to spend on goods and services such as food, housing, education, health, and leisure activities. It’s important to ensure that we can afford all of the essentials that give us a high and comfortable standard of living. Countries which are poor – and where therefore people’s expenditure is very low – can be found, richer countries are further towards the right. This is shown on a log axis by default, but you can change it to a linear scale on the interactive chart. Both metrics are measured in US dollars per person per year. What we see is a strong positive relationship: where expenditures are high people tend to spend more money on food At expenditures below $5,000, the average person tends to spend less than $1,000 on food. At expenditures above $10,000, it's common for the average to be $2,000 or more per person per year. <Chart url="https://ourworldindata.org/grapher/food-expenditure-vs-gdp"/> ## For richer people, food makes up a smaller share of their expenditure The amount of money spent on food might increase in absolute te… | {"id": 55521, "date": "2023-01-19T11:43:15", "guid": {"rendered": "https://owid.cloud/?p=55521"}, "link": "https://owid.cloud/engels-law-food-spending", "meta": {"owid_publication_context_meta_field": {"latest": true, "homepage": true, "immediate_newsletter": true}}, "slug": "engels-law-food-spending", "tags": [], "type": "post", "title": {"rendered": "Engel’s Law: Richer people spend more money on food, but it makes up a smaller share of their income"}, "_links": {"self": [{"href": "https://owid.cloud/wp-json/wp/v2/posts/55521"}], "about": [{"href": "https://owid.cloud/wp-json/wp/v2/types/post"}], "author": [{"href": "https://owid.cloud/wp-json/wp/v2/users/17", "embeddable": true}], "curies": [{"href": "https://api.w.org/{rel}", "name": "wp", "templated": true}], "replies": [{"href": "https://owid.cloud/wp-json/wp/v2/comments?post=55521", "embeddable": true}], "wp:term": [{"href": "https://owid.cloud/wp-json/wp/v2/categories?post=55521", "taxonomy": "category", "embeddable": true}, {"href": "https://owid.cloud/wp-json/wp/v2/tags?post=55521", "taxonomy": "post_tag", "embeddable": true}], "collection": [{"href": "https://owid.cloud/wp-json/wp/v2/posts"}], "wp:attachment": [{"href": "https://owid.cloud/wp-json/wp/v2/media?parent=55521"}], "version-history": [{"href": "https://owid.cloud/wp-json/wp/v2/posts/55521/revisions", "count": 4}], "wp:featuredmedia": [{"href": "https://owid.cloud/wp-json/wp/v2/media/55399", "embeddable": true}], "predecessor-version": [{"id": 55548, "href": "https://owid.cloud/wp-json/wp/v2/posts/55521/revisions/55548"}]}, "author": 17, "format": "standard", "status": "publish", "sticky": false, "content": {"rendered": "\n<div class=\"wp-block-columns\">\n<div class=\"wp-block-column\">\n<p>Richer people tend to spend more money on food.</p>\n\n\n\n<p>We see this relationship when we look at data on food expenditure from across the world.</p>\n\n\n\n<p>In the chart you see food expenditure plotted against total consumer expenditure per person. Total consumer expenditure is any personal… |
| 1175 | 1175 | 55458 | We published a redesign of our work on Democracy | democracy-redesign | post | publish | {"id": "wp-55458", "slug": "democracy-redesign", "content": {"toc": [], "body": [], "type": "article", "title": "We published a redesign of our work on Democracy", "authors": ["Bastian Herre"], "excerpt": "We published a major redesign of our work on Democracy. Explore all our data and research in one place.", "dateline": "January 26, 2023", "subtitle": "We published a major redesign of our work on Democracy. Explore all our data and research in one place.", "sidebar-toc": false, "featured-image": "Thumbnail-Democracy_Blue_01.png"}, "createdAt": "2023-01-13T09:28:16.000Z", "published": false, "updatedAt": "2023-03-14T20:45:03.000Z", "revisionId": null, "publishedAt": "2023-01-26T12:26:00.000Z", "relatedCharts": [], "publicationContext": "listed"} | {"errors": [], "numBlocks": 0, "numErrors": 0, "wpTagCounts": {}, "htmlTagCounts": {}} | 2023-01-26 12:26:00 | 2024-02-16 14:22:54 | ["Bastian Herre"] | We published a major redesign of our work on Democracy. Explore all our data and research in one place. | 2023-01-13 09:28:16 | 2023-03-14 20:45:03 | https://ourworldindata.org/wp-content/uploads/2023/01/Thumbnail-Democracy_Blue_01.png | {} | {"id": 55458, "date": "2023-01-26T12:26:00", "guid": {"rendered": "https://owid.cloud/?p=55458"}, "link": "https://owid.cloud/democracy-redesign", "meta": {"owid_publication_context_meta_field": {"latest": true, "homepage": true, "immediate_newsletter": true}}, "slug": "democracy-redesign", "tags": [], "type": "post", "title": {"rendered": "We published a redesign of our work on Democracy"}, "_links": {"self": [{"href": "https://owid.cloud/wp-json/wp/v2/posts/55458"}], "about": [{"href": "https://owid.cloud/wp-json/wp/v2/types/post"}], "author": [{"href": "https://owid.cloud/wp-json/wp/v2/users/49", "embeddable": true}], "curies": [{"href": "https://api.w.org/{rel}", "name": "wp", "templated": true}], "replies": [{"href": "https://owid.cloud/wp-json/wp/v2/comments?post=55458", "embeddable": true}], "wp:term": [{"href": "https://owid.cloud/wp-json/wp/v2/categories?post=55458", "taxonomy": "category", "embeddable": true}, {"href": "https://owid.cloud/wp-json/wp/v2/tags?post=55458", "taxonomy": "post_tag", "embeddable": true}], "collection": [{"href": "https://owid.cloud/wp-json/wp/v2/posts"}], "wp:attachment": [{"href": "https://owid.cloud/wp-json/wp/v2/media?parent=55458"}], "version-history": [{"href": "https://owid.cloud/wp-json/wp/v2/posts/55458/revisions", "count": 3}], "wp:featuredmedia": [{"href": "https://owid.cloud/wp-json/wp/v2/media/55625", "embeddable": true}], "predecessor-version": [{"id": 56275, "href": "https://owid.cloud/wp-json/wp/v2/posts/55458/revisions/56275"}]}, "author": 49, "format": "standard", "status": "publish", "sticky": false, "content": {"rendered": "", "protected": false}, "excerpt": {"rendered": "We published a major redesign of our work on Democracy. Explore all our data and research in one place.", "protected": false}, "date_gmt": "2023-01-26T12:26:00", "modified": "2023-03-14T20:45:03", "template": "", "categories": [1], "ping_status": "closed", "authors_name": ["Bastian Herre"], "modified_gmt": "2023-03-14T20:45:03", "comment_status": "closed", "featured_media": 55625, "featured… | |||
| 1170 | 1170 | 55179 | We just published a redesign of our work on Biodiversity | biodiversity-redesign | post | publish | {"id": "wp-55179", "slug": "biodiversity-redesign", "content": {"toc": [], "body": [], "type": "article", "title": "We just published a redesign of our work on Biodiversity", "authors": ["Hannah Ritchie", "Fiona Spooner"], "excerpt": "We just published a major redesign of our work on Biodiversity. Explore all our data and research in one place.", "dateline": "December 20, 2022", "subtitle": "We just published a major redesign of our work on Biodiversity. Explore all our data and research in one place.", "sidebar-toc": false, "featured-image": "Biodiversity-thumbnail.png"}, "createdAt": "2022-12-19T17:56:03.000Z", "published": false, "updatedAt": "2022-12-20T10:42:29.000Z", "revisionId": null, "publishedAt": "2022-12-20T09:00:00.000Z", "relatedCharts": [], "publicationContext": "listed"} | {"errors": [], "numBlocks": 0, "numErrors": 0, "wpTagCounts": {}, "htmlTagCounts": {}} | 2022-12-20 09:00:00 | 2024-02-16 14:22:54 | ["Hannah Ritchie", "Fiona Spooner"] | We just published a major redesign of our work on Biodiversity. Explore all our data and research in one place. | 2022-12-19 17:56:03 | 2022-12-20 10:42:29 | https://ourworldindata.org/wp-content/uploads/2021/03/Biodiversity-thumbnail.png | {} | {"id": 55179, "date": "2022-12-20T09:00:00", "guid": {"rendered": "https://owid.cloud/?p=55179"}, "link": "https://owid.cloud/biodiversity-redesign", "meta": {"owid_publication_context_meta_field": {"latest": true, "homepage": true, "immediate_newsletter": true}}, "slug": "biodiversity-redesign", "tags": [], "type": "post", "title": {"rendered": "We just published a redesign of our work on Biodiversity"}, "_links": {"self": [{"href": "https://owid.cloud/wp-json/wp/v2/posts/55179"}], "about": [{"href": "https://owid.cloud/wp-json/wp/v2/types/post"}], "author": [{"href": "https://owid.cloud/wp-json/wp/v2/users/17", "embeddable": true}], "curies": [{"href": "https://api.w.org/{rel}", "name": "wp", "templated": true}], "replies": [{"href": "https://owid.cloud/wp-json/wp/v2/comments?post=55179", "embeddable": true}], "wp:term": [{"href": "https://owid.cloud/wp-json/wp/v2/categories?post=55179", "taxonomy": "category", "embeddable": true}, {"href": "https://owid.cloud/wp-json/wp/v2/tags?post=55179", "taxonomy": "post_tag", "embeddable": true}], "collection": [{"href": "https://owid.cloud/wp-json/wp/v2/posts"}], "wp:attachment": [{"href": "https://owid.cloud/wp-json/wp/v2/media?parent=55179"}], "version-history": [{"href": "https://owid.cloud/wp-json/wp/v2/posts/55179/revisions", "count": 2}], "wp:featuredmedia": [{"href": "https://owid.cloud/wp-json/wp/v2/media/42155", "embeddable": true}], "predecessor-version": [{"id": 55182, "href": "https://owid.cloud/wp-json/wp/v2/posts/55179/revisions/55182"}]}, "author": 17, "format": "standard", "status": "publish", "sticky": false, "content": {"rendered": "", "protected": false}, "excerpt": {"rendered": "We just published a major redesign of our work on Biodiversity. Explore all our data and research in one place.", "protected": false}, "date_gmt": "2022-12-20T09:00:00", "modified": "2022-12-20T10:42:29", "template": "", "categories": [1], "ping_status": "closed", "authors_name": ["Hannah Ritchie", "Fiona Spooner"], "modified_gmt": "2022-12-20T10:42:29", "comment_status": "clo… | |||
| 1169 | 1169 | 55153 | The 'Varieties of Democracy' data: how do researchers measure human rights? | vdem-human-rights-data | post | publish | <!-- wp:paragraph -->
<p>Measuring the state of human rights across the world helps us understand the extent to which people have fundamental personal and civil rights and freedoms.</p>
<!-- /wp:paragraph -->
<!-- wp:paragraph -->
<p>But it can be challenging to measure how well-protected these human rights are.. People do not always agree on what rights are fundamental. These rights — such as whether people are free to voice their opinions — are difficult to define and assess. The judgement of experts is to some degree subjective. They may disagree about a specific characteristic or how several characteristics can be reduced into a single measure.</p>
<!-- /wp:paragraph -->
<!-- wp:paragraph -->
<p>How do researchers address these challenges and measure how much people’s human rights are protected?</p>
<!-- /wp:paragraph -->
<!-- wp:heading {"level":4} -->
<h4><strong>What are the Varieties of Democracy project?</strong></h4>
<!-- /wp:heading -->
<!-- wp:paragraph -->
<p>In some of our work on democracy, we rely on data published by the <a href="https://www.v-dem.net/vdemds.html">Varieties of Democracy (V-Dem) project</a>.{ref}Coppedge, Michael, John Gerring, Carl Henrik Knutsen, Staffan I. Lindberg, Jan Teorell, Nazifa Alizada, David Altman, Michael Bernhard, Agnes Cornell, M. Steven Fish, Lisa Gastaldi, Haakon Gjerløw, Adam Glynn, Sandra Grahn, Allen Hicken, Garry Hindle, Nina Ilchenko, Katrin Kinzelbach, Joshua Krusell, Kyle L. Marquardt, Kelly McMann, Valeriya Mechkova, Juraj Medzihorsky, Pamela Paxton, Daniel Pemstein, Josefine Pernes, Oskar Ryden, Johannes von Römer, Brigitte Seim, Rachel Sigman, Svend-Erik Skaaning, Jeffrey Staton, Aksel Sundström, Eitan Tzelgov, Yi-ting Wang, Tore Wig, Steven Wilson and Daniel Ziblatt. 2022.<a href="https://scholar.google.com/scholar?hl=en&as_sdt=0%2C5&q=Coppedge%2C+Michael%2C+John+Gerring%2C+Carl+Henrik+Knutsen%2C+Staffan+I.+Lindberg%2C+Jan+Teorell%2C+Nazifa+Alizada%2C+David+Altman%2C+Michael+Bernhard%2C+Agnes+Cornell%2C+M.+Steven+Fish%2C+Lisa+Gastaldi%2C+Ha… |
{"id": "wp-55153", "slug": "vdem-human-rights-data", "content": {"toc": [], "body": [{"type": "text", "value": [{"text": "Measuring the state of human rights across the world helps us understand the extent to which people have fundamental personal and civil rights and freedoms.", "spanType": "span-simple-text"}], "parseErrors": []}, {"type": "text", "value": [{"text": "But it can be challenging to measure how well-protected these human rights are.. People do not always agree on what rights are fundamental. These rights — such as whether people are free to voice their opinions — are difficult to define and assess. The judgement of experts is to some degree subjective. They may disagree about a specific characteristic or how several characteristics can be reduced into a single measure.", "spanType": "span-simple-text"}], "parseErrors": []}, {"type": "text", "value": [{"text": "How do researchers address these challenges and measure how much people’s human rights are protected?", "spanType": "span-simple-text"}], "parseErrors": []}, {"text": [{"children": [{"text": "What are the Varieties of Democracy project?", "spanType": "span-simple-text"}], "spanType": "span-bold"}], "type": "heading", "level": 2, "parseErrors": []}, {"type": "text", "value": [{"text": "In some of our work on democracy, we rely on data published by the ", "spanType": "span-simple-text"}, {"url": "https://www.v-dem.net/vdemds.html", "children": [{"text": "Varieties of Democracy (V-Dem) project", "spanType": "span-simple-text"}], "spanType": "span-link"}, {"text": ".{ref}Coppedge, Michael, John Gerring, Carl Henrik Knutsen, Staffan I. Lindberg, Jan Teorell, Nazifa Alizada, David Altman, Michael Bernhard, Agnes Cornell, M. Steven Fish, Lisa Gastaldi, Haakon Gjerløw, Adam Glynn, Sandra Grahn, Allen Hicken, Garry Hindle, Nina Ilchenko, Katrin Kinzelbach, Joshua Krusell, Kyle L. Marquardt, Kelly McMann, Valeriya Mechkova, Juraj Medzihorsky, Pamela Paxton, Daniel Pemstein, Josefine Pernes, Oskar Ryden, Johannes von Römer, Brigitte Seim, Rachel Sigman,… | {"errors": [{"name": "unexpected wp component tag", "details": "Found unhandled wp:comment tag list"}, {"name": "unhandled html tag found", "details": "Encountered the unhandled tag meta"}], "numBlocks": 77, "numErrors": 2, "wpTagCounts": {"html": 2, "list": 1, "heading": 17, "paragraph": 56, "owid/prominent-link": 1}, "htmlTagCounts": {"p": 56, "h4": 13, "h5": 4, "ul": 1, "meta": 1, "iframe": 2}} | 2022-12-16 17:33:07 | 2024-02-16 14:22:54 | 1Hy_mYebgaQCiZLU2AM3aRUBMebz6zGrj7uFLjdnDJkU | ["Bastian Herre"] | There are several ways to measure human rights. Here is how the Varieties of Democracy project does it, one of the leading sources of global human rights data. | 2022-12-16 17:12:36 | 2023-06-08 09:57:14 | https://ourworldindata.org/wp-content/uploads/2022/12/distribution-human-rights-vdem.png | {} | Measuring the state of human rights across the world helps us understand the extent to which people have fundamental personal and civil rights and freedoms. But it can be challenging to measure how well-protected these human rights are.. People do not always agree on what rights are fundamental. These rights — such as whether people are free to voice their opinions — are difficult to define and assess. The judgement of experts is to some degree subjective. They may disagree about a specific characteristic or how several characteristics can be reduced into a single measure. How do researchers address these challenges and measure how much people’s human rights are protected? ## **What are the Varieties of Democracy project?** In some of our work on democracy, we rely on data published by the [Varieties of Democracy (V-Dem) project](https://www.v-dem.net/vdemds.html).{ref}Coppedge, Michael, John Gerring, Carl Henrik Knutsen, Staffan I. Lindberg, Jan Teorell, Nazifa Alizada, David Altman, Michael Bernhard, Agnes Cornell, M. Steven Fish, Lisa Gastaldi, Haakon Gjerløw, Adam Glynn, Sandra Grahn, Allen Hicken, Garry Hindle, Nina Ilchenko, Katrin Kinzelbach, Joshua Krusell, Kyle L. Marquardt, Kelly McMann, Valeriya Mechkova, Juraj Medzihorsky, Pamela Paxton, Daniel Pemstein, Josefine Pernes, Oskar Ryden, Johannes von Römer, Brigitte Seim, Rachel Sigman, Svend-Erik Skaaning, Jeffrey Staton, Aksel Sundström, Eitan Tzelgov, Yi-ting Wang, Tore Wig, Steven Wilson and Daniel Ziblatt. 2022.[ VDem [Country–Year/Country–Date] Dataset v12](https://scholar.google.com/scholar?hl=en&as_sdt=0%2C5&q=Coppedge%2C+Michael%2C+John+Gerring%2C+Carl+Henrik+Knutsen%2C+Staffan+I.+Lindberg%2C+Jan+Teorell%2C+Nazifa+Alizada%2C+David+Altman%2C+Michael+Bernhard%2C+Agnes+Cornell%2C+M.+Steven+Fish%2C+Lisa+Gastaldi%2C+Haakon+Gjerl%C3%B8w%2C+Adam+Glynn%2C+Sandra+Grahn%2C+Allen+Hicken%2C+Garry+Hindle%2C+Nina+Ilchenko%2C+Katrin+Kinzelbach%2C+Joshua+Krusell%2C+Kyle+L.+Marquardt%2C+Kelly+McMann%2C+Valeriya+Mechkova%2C+Juraj+Medzihorsky%2C+Pamela+Paxton%2… | {"id": 55153, "date": "2022-12-16T17:33:07", "guid": {"rendered": "https://owid.cloud/?p=55153"}, "link": "https://owid.cloud/vdem-human-rights-data", "meta": {"owid_publication_context_meta_field": []}, "slug": "vdem-human-rights-data", "tags": [], "type": "post", "title": {"rendered": "The ‘Varieties of Democracy’ data: how do researchers measure human rights?"}, "_links": {"self": [{"href": "https://owid.cloud/wp-json/wp/v2/posts/55153"}], "about": [{"href": "https://owid.cloud/wp-json/wp/v2/types/post"}], "author": [{"href": "https://owid.cloud/wp-json/wp/v2/users/49", "embeddable": true}], "curies": [{"href": "https://api.w.org/{rel}", "name": "wp", "templated": true}], "replies": [{"href": "https://owid.cloud/wp-json/wp/v2/comments?post=55153", "embeddable": true}], "wp:term": [{"href": "https://owid.cloud/wp-json/wp/v2/categories?post=55153", "taxonomy": "category", "embeddable": true}, {"href": "https://owid.cloud/wp-json/wp/v2/tags?post=55153", "taxonomy": "post_tag", "embeddable": true}], "collection": [{"href": "https://owid.cloud/wp-json/wp/v2/posts"}], "wp:attachment": [{"href": "https://owid.cloud/wp-json/wp/v2/media?parent=55153"}], "version-history": [{"href": "https://owid.cloud/wp-json/wp/v2/posts/55153/revisions", "count": 19}], "wp:featuredmedia": [{"href": "https://owid.cloud/wp-json/wp/v2/media/55154", "embeddable": true}], "predecessor-version": [{"id": 57351, "href": "https://owid.cloud/wp-json/wp/v2/posts/55153/revisions/57351"}]}, "author": 49, "format": "standard", "status": "publish", "sticky": false, "content": {"rendered": "\n<p>Measuring the state of human rights across the world helps us understand the extent to which people have fundamental personal and civil rights and freedoms.</p>\n\n\n\n<p>But it can be challenging to measure how well-protected these human rights are.. People do not always agree on what rights are fundamental. These rights — such as whether people are free to voice their opinions — are difficult to define and assess. The judgement of experts is to … |
| 1168 | 1168 | 55049 | Wild mammals make up only a few percent of the world’s mammals | wild-mammals-birds-biomass | post | publish | <!-- wp:columns -->
<div class="wp-block-columns"><!-- wp:column -->
<div class="wp-block-column"><!-- wp:paragraph -->
<p>Humans have transformed the mammal kingdom.</p>
<!-- /wp:paragraph -->
<!-- wp:paragraph -->
<p>A diverse range of mammals once roamed the planet. This changed quickly and dramatically with the arrival of humans. Since then, wild land mammal biomass <a href="https://ourworldindata.org/wild-mammal-decline">has declined</a> by an estimated 85%.</p>
<!-- /wp:paragraph -->
<!-- wp:paragraph -->
<p>Humans are now the dominant species.</p>
<!-- /wp:paragraph -->
<!-- wp:paragraph -->
<p>We see this when we look at the distribution of mammals across the world today.</p>
<!-- /wp:paragraph -->
<!-- wp:paragraph -->
<p>There are various ways that we could look at mammal species: we could compare them based on the number of individuals: their <em>abundance</em>. This tends to favor very small animals with large populations and doesn’t necessarily give us an idea of how dominant different species are.</p>
<!-- /wp:paragraph -->
<!-- wp:paragraph -->
<p>Instead, ecologists often look at a different metric: biomass. This not only takes into account the <em>number</em> of animals but also factors in their size. Each animal is measured in tonnes of carbon, the fundamental building block of life.{ref}To calculate the biomass of a taxonomic group, the researchers multiplied the carbon stock for a single organism by the number of individuals in that group. In humans, for example, they calculate the average carbon quantity of a person and multiply by the human population. If you want to quickly estimate your carbon biomass: calculate 15% of your weight.{/ref} Biomass gives us a measure of the total biological productivity of an ecosystem. It also gives more weight to larger animals at higher levels of the ecological ‘pyramid’: these rely on well-functioning bases below them.</p>
<!-- /wp:paragraph -->
<!-- wp:paragraph -->
<p>Let’s then look at the breakdown of the global mammal kingdom in 2015. This data… |
{"id": "wp-55049", "slug": "wild-mammals-birds-biomass", "content": {"toc": [], "body": [{"left": [{"type": "text", "value": [{"text": "Humans have transformed the mammal kingdom.", "spanType": "span-simple-text"}], "parseErrors": []}, {"type": "text", "value": [{"text": "A diverse range of mammals once roamed the planet. This changed quickly and dramatically with the arrival of humans. Since then, wild land mammal biomass ", "spanType": "span-simple-text"}, {"url": "https://ourworldindata.org/wild-mammal-decline", "children": [{"text": "has declined", "spanType": "span-simple-text"}], "spanType": "span-link"}, {"text": " by an estimated 85%.", "spanType": "span-simple-text"}], "parseErrors": []}, {"type": "text", "value": [{"text": "Humans are now the dominant species.", "spanType": "span-simple-text"}], "parseErrors": []}, {"type": "text", "value": [{"text": "We see this when we look at the distribution of mammals across the world today.", "spanType": "span-simple-text"}], "parseErrors": []}, {"type": "text", "value": [{"text": "There are various ways that we could look at mammal species: we could compare them based on the number of individuals: their ", "spanType": "span-simple-text"}, {"children": [{"text": "abundance", "spanType": "span-simple-text"}], "spanType": "span-italic"}, {"text": ". This tends to favor very small animals with large populations and doesn’t necessarily give us an idea of how dominant different species are.", "spanType": "span-simple-text"}], "parseErrors": []}, {"type": "text", "value": [{"text": "Instead, ecologists often look at a different metric: biomass. This not only takes into account the ", "spanType": "span-simple-text"}, {"children": [{"text": "number", "spanType": "span-simple-text"}], "spanType": "span-italic"}, {"text": " of animals but also factors in their size. Each animal is measured in tonnes of carbon, the fundamental building block of life.{ref}To calculate the biomass of a taxonomic group, the researchers multiplied the carbon stock for a single organism by the nu… | {"errors": [{"name": "unexpected wp component tag", "details": "Found unhandled wp:comment tag image"}, {"name": "unexpected wp component tag", "details": "Found unhandled wp:comment tag image"}, {"name": "unexpected wp component tag", "details": "Found unhandled wp:comment tag image"}], "numBlocks": 11, "numErrors": 3, "wpTagCounts": {"image": 3, "column": 6, "columns": 3, "heading": 4, "paragraph": 28, "owid/prominent-link": 3}, "htmlTagCounts": {"p": 28, "h3": 2, "h5": 2, "div": 9, "figure": 3}} | 2022-12-15 10:00:00 | 2024-03-10 13:04:18 | 1RJ4x30eYNY1FMG6br7jI8D02z8kb4cQTN-YX-IOm9xs | ["Hannah Ritchie"] | Livestock make up 62% of the world’s mammal biomass; humans account for 34%; and wild mammals are just 4%. | 2022-12-09 12:12:11 | 2023-08-03 15:11:26 | https://ourworldindata.org/wp-content/uploads/2022/11/Mammal-distribution-thumbnail.png | {} | Humans have transformed the mammal kingdom. A diverse range of mammals once roamed the planet. This changed quickly and dramatically with the arrival of humans. Since then, wild land mammal biomass [has declined](https://ourworldindata.org/wild-mammal-decline) by an estimated 85%. Humans are now the dominant species. We see this when we look at the distribution of mammals across the world today. There are various ways that we could look at mammal species: we could compare them based on the number of individuals: their _abundance_. This tends to favor very small animals with large populations and doesn’t necessarily give us an idea of how dominant different species are. Instead, ecologists often look at a different metric: biomass. This not only takes into account the _number_ of animals but also factors in their size. Each animal is measured in tonnes of carbon, the fundamental building block of life.{ref}To calculate the biomass of a taxonomic group, the researchers multiplied the carbon stock for a single organism by the number of individuals in that group. In humans, for example, they calculate the average carbon quantity of a person and multiply by the human population. If you want to quickly estimate your carbon biomass: calculate 15% of your weight.{/ref} Biomass gives us a measure of the total biological productivity of an ecosystem. It also gives more weight to larger animals at higher levels of the ecological ‘pyramid’: these rely on well-functioning bases below them. Let’s then look at the breakdown of the global mammal kingdom in 2015. This data is sourced from the study by Yinon Bar-On, Rob Phillips, and Ron Milo.{ref}Bar-On, Y. M., Phillips, R., & Milo, R. (2018). [The biomass distribution on Earth](https://www.pnas.org/content/115/25/6506). _Proceedings of the National Academy of Sciences_, 115(25), 6506-6511.{/ref} Each icon is equivalent to around one million tonnes of carbon. This includes both land and marine wild mammals. Wild mammals make up just 4% of the mammal kingdom. The dominanc… | {"id": 55049, "date": "2022-12-15T10:00:00", "guid": {"rendered": "https://owid.cloud/?p=55049"}, "link": "https://owid.cloud/wild-mammals-birds-biomass", "meta": {"owid_publication_context_meta_field": []}, "slug": "wild-mammals-birds-biomass", "tags": [], "type": "post", "title": {"rendered": "Wild mammals make up only a few percent of the world’s mammals"}, "_links": {"self": [{"href": "https://owid.cloud/wp-json/wp/v2/posts/55049"}], "about": [{"href": "https://owid.cloud/wp-json/wp/v2/types/post"}], "author": [{"href": "https://owid.cloud/wp-json/wp/v2/users/17", "embeddable": true}], "curies": [{"href": "https://api.w.org/{rel}", "name": "wp", "templated": true}], "replies": [{"href": "https://owid.cloud/wp-json/wp/v2/comments?post=55049", "embeddable": true}], "wp:term": [{"href": "https://owid.cloud/wp-json/wp/v2/categories?post=55049", "taxonomy": "category", "embeddable": true}, {"href": "https://owid.cloud/wp-json/wp/v2/tags?post=55049", "taxonomy": "post_tag", "embeddable": true}], "collection": [{"href": "https://owid.cloud/wp-json/wp/v2/posts"}], "wp:attachment": [{"href": "https://owid.cloud/wp-json/wp/v2/media?parent=55049"}], "version-history": [{"href": "https://owid.cloud/wp-json/wp/v2/posts/55049/revisions", "count": 2}], "wp:featuredmedia": [{"href": "https://owid.cloud/wp-json/wp/v2/media/54667", "embeddable": true}], "predecessor-version": [{"id": 55053, "href": "https://owid.cloud/wp-json/wp/v2/posts/55049/revisions/55053"}]}, "author": 17, "format": "standard", "status": "publish", "sticky": false, "content": {"rendered": "\n<div class=\"wp-block-columns\">\n<div class=\"wp-block-column\">\n<p>Humans have transformed the mammal kingdom.</p>\n\n\n\n<p>A diverse range of mammals once roamed the planet. This changed quickly and dramatically with the arrival of humans. Since then, wild land mammal biomass <a href=\"https://ourworldindata.org/wild-mammal-decline\">has declined</a> by an estimated 85%.</p>\n\n\n\n<p>Humans are now the dominant species.</p>\n\n\n\n<p>We see this when we look at … |
| 1166 | 1166 | 54861 | Technology over the long run: zoom out to see how dramatically the world can change within a lifetime | technology-long-run | post | publish | <!-- wp:html -->
<div class="blog-info">
<p>Our World in Data presents the data and research to make progress against the world’s largest problems.<br>This article draws on data and research discussed in our entry on <strong><a href="https://ourworldindata.org/artificial-intelligence" target="_blank" rel="noopener">Artificial Intelligence</a></strong>.</p>
</div>
<!-- /wp:html -->
<!-- wp:paragraph -->
<p>Technology can change the world in ways that are unimaginable, until they happen. Switching on an electric light would have been unimaginable for our medieval ancestors. In their childhood, our grandparents would have struggled to imagine a world connected by smartphones and the Internet.</p>
<!-- /wp:paragraph -->
<!-- wp:paragraph -->
<p>Similarly, it is hard for us to imagine the arrival of all those technologies that will fundamentally change the world we are used to.</p>
<!-- /wp:paragraph -->
<!-- wp:paragraph -->
<p>We can remind ourselves that our own future might look very different from the world today by looking back at how rapidly technology has changed our world in the past. That’s what this article is about. </p>
<!-- /wp:paragraph -->
<!-- wp:paragraph -->
<p>One insight I take away from this long-term perspective is how unusual our time is. Technological change was <em>extremely</em> slow in the past – the technologies that our ancestors got used to in their childhood were still central to their lives in their old age. In stark contrast to those days, we live in a time of extraordinarily fast technological change. For recent generations, it was common for technologies that were unimaginable in their youth to become common later in life. </p>
<!-- /wp:paragraph -->
<!-- wp:heading {"level":4} -->
<h4>The long-run perspective on technological change</h4>
<!-- /wp:heading -->
<!-- wp:columns -->
<div class="wp-block-columns"><!-- wp:column -->
<div class="wp-block-column"><!-- wp:paragraph -->
<p>The big visualization offers a long-term perspective on the history of technology.{ref}T… |
{"id": "wp-54861", "slug": "technology-long-run", "content": {"toc": [], "body": [{"type": "text", "value": [{"text": "Our World in Data presents the data and research to make progress against the world’s largest problems.", "spanType": "span-simple-text"}, {"spanType": "span-newline"}, {"text": "This article draws on data and research discussed in our entry on ", "spanType": "span-simple-text"}, {"children": [{"url": "https://ourworldindata.org/artificial-intelligence", "children": [{"text": "Artificial Intelligence", "spanType": "span-simple-text"}], "spanType": "span-link"}], "spanType": "span-bold"}, {"text": ".", "spanType": "span-simple-text"}], "parseErrors": []}, {"type": "text", "value": [{"text": "Technology can change the world in ways that are unimaginable, until they happen. Switching on an electric light would have been unimaginable for our medieval ancestors. In their childhood, our grandparents would have struggled to imagine a world connected by smartphones and the Internet.", "spanType": "span-simple-text"}], "parseErrors": []}, {"type": "text", "value": [{"text": "Similarly, it is hard for us to imagine the arrival of all those technologies that will fundamentally change the world we are used to.", "spanType": "span-simple-text"}], "parseErrors": []}, {"type": "text", "value": [{"text": "We can remind ourselves that our own future might look very different from the world today by looking back at how rapidly technology has changed our world in the past. That’s what this article is about. ", "spanType": "span-simple-text"}], "parseErrors": []}, {"type": "text", "value": [{"text": "One insight I take away from this long-term perspective is how unusual our time is. Technological change was ", "spanType": "span-simple-text"}, {"children": [{"text": "extremely", "spanType": "span-simple-text"}], "spanType": "span-italic"}, {"text": " slow in the past – the technologies that our ancestors got used to in their childhood were still central to their lives in their old age. In stark contrast to those days… | {"errors": [{"name": "unexpected wp component tag", "details": "Found unhandled wp:comment tag image"}, {"name": "too many figcaption elements after archieml transform", "details": "Found 10 elements after transforming to archieml"}, {"name": "unexpected wp component tag", "details": "Found unhandled wp:comment tag image"}, {"name": "unhandled html tag found", "details": "Encountered the unhandled tag hr"}, {"name": "unexpected wp component tag", "details": "Found unhandled wp:comment tag separator"}, {"name": "prominent link missing title", "details": "Prominent link is missing a title attribute"}, {"name": "unexpected wp component tag", "details": "Found unhandled wp:comment tag spacer"}], "numBlocks": 15, "numErrors": 7, "wpTagCounts": {"html": 1, "image": 2, "column": 2, "spacer": 1, "columns": 1, "heading": 2, "paragraph": 32, "separator": 1, "owid/prominent-link": 1}, "htmlTagCounts": {"p": 33, "h4": 2, "hr": 1, "div": 5, "figure": 2, "figcaption": 1}} | 2023-02-22 11:00:00 | 2024-02-16 14:22:54 | 1Wln_wppvv0wJNp0yqlKyToN2kokcacMK-nvYC0JSc0E | ["Max Roser"] | It is easy to underestimate how much the world can change within a lifetime. Bringing to mind how dramatically the world has changed can help us see how different the world could be in a few years or decades. | 2022-12-02 20:24:58 | 2023-10-11 08:43:29 | https://ourworldindata.org/wp-content/uploads/2022/12/featured-image-Longterm-timeline-of-technology.png | {} | Our World in Data presents the data and research to make progress against the world’s largest problems. This article draws on data and research discussed in our entry on **[Artificial Intelligence](https://ourworldindata.org/artificial-intelligence)**. Technology can change the world in ways that are unimaginable, until they happen. Switching on an electric light would have been unimaginable for our medieval ancestors. In their childhood, our grandparents would have struggled to imagine a world connected by smartphones and the Internet. Similarly, it is hard for us to imagine the arrival of all those technologies that will fundamentally change the world we are used to. We can remind ourselves that our own future might look very different from the world today by looking back at how rapidly technology has changed our world in the past. That’s what this article is about. One insight I take away from this long-term perspective is how unusual our time is. Technological change was _extremely_ slow in the past – the technologies that our ancestors got used to in their childhood were still central to their lives in their old age. In stark contrast to those days, we live in a time of extraordinarily fast technological change. For recent generations, it was common for technologies that were unimaginable in their youth to become common later in life. ## The long-run perspective on technological change The big visualization offers a long-term perspective on the history of technology.{ref}The recent speed of technological change makes it difficult to picture the history of technology in one visualization. When you visualize this development on a linear timeline then most of the timeline is almost empty, while all the action is crammed into the right-corner: <Image filename="cH9kcyrR2oopnW-KiDAAnAGVsMA-h0D9L-rPaG7lUr74vHI6xguNWEKZ6Gy047SOBN8lC5sXEbYLvaf_mWLDZ1K_LFoYij_K-e6gOwGjH3p5YGhRQPyWFMPnJAEDM6hhNIfaS2S94pYeaXdW4-risESc3T83GfHXLqf4mv4EHaHdBHw1kuXXTRW8Z-FPrQ" alt=""/> In my large visualization here I tried to a… | {"id": 54861, "date": "2023-02-22T11:00:00", "guid": {"rendered": "https://owid.cloud/?p=54861"}, "link": "https://owid.cloud/technology-long-run", "meta": {"owid_publication_context_meta_field": {"latest": true, "homepage": true, "immediate_newsletter": true}}, "slug": "technology-long-run", "tags": [], "type": "post", "title": {"rendered": "Technology over the long run: zoom out to see how dramatically the world can change within a lifetime"}, "_links": {"self": [{"href": "https://owid.cloud/wp-json/wp/v2/posts/54861"}], "about": [{"href": "https://owid.cloud/wp-json/wp/v2/types/post"}], "author": [{"href": "https://owid.cloud/wp-json/wp/v2/users/2", "embeddable": true}], "curies": [{"href": "https://api.w.org/{rel}", "name": "wp", "templated": true}], "replies": [{"href": "https://owid.cloud/wp-json/wp/v2/comments?post=54861", "embeddable": true}], "wp:term": [{"href": "https://owid.cloud/wp-json/wp/v2/categories?post=54861", "taxonomy": "category", "embeddable": true}, {"href": "https://owid.cloud/wp-json/wp/v2/tags?post=54861", "taxonomy": "post_tag", "embeddable": true}], "collection": [{"href": "https://owid.cloud/wp-json/wp/v2/posts"}], "wp:attachment": [{"href": "https://owid.cloud/wp-json/wp/v2/media?parent=54861"}], "version-history": [{"href": "https://owid.cloud/wp-json/wp/v2/posts/54861/revisions", "count": 10}], "wp:featuredmedia": [{"href": "https://owid.cloud/wp-json/wp/v2/media/54867", "embeddable": true}], "predecessor-version": [{"id": 58292, "href": "https://owid.cloud/wp-json/wp/v2/posts/54861/revisions/58292"}]}, "author": 2, "format": "standard", "status": "publish", "sticky": false, "content": {"rendered": "\n<div class=\"blog-info\">\n<p>Our World in Data presents the data and research to make progress against the world’s largest problems.<br>This article draws on data and research discussed in our entry on <strong><a href=\"https://ourworldindata.org/artificial-intelligence\" target=\"_blank\" rel=\"noopener\">Artificial Intelligence</a></strong>.</p>\n</div>\n\n\n\n<p>Technology can ch… |
| 1165 | 1165 | 54836 | AI timelines: What do experts in artificial intelligence expect for the future? | ai-timelines | post | publish | <!-- wp:html -->
<div class="blog-info">
<p>Our World in Data presents the data and research to make progress against the world’s largest problems.<br>This article draws on data and research discussed in our entry on <strong><a href="https://ourworldindata.org/artificial-intelligence" target="_blank" rel="noopener">Artificial Intelligence</a></strong>.</p>
</div>
<!-- /wp:html -->
<!-- wp:columns -->
<div class="wp-block-columns"><!-- wp:column -->
<div class="wp-block-column"><!-- wp:paragraph -->
<p>Artificial intelligence (AI) that surpasses our own intelligence sounds like the stuff from science-fiction books or films. What do experts in the field of AI research think about such scenarios? Do they dismiss these ideas as fantasy, or are they taking such prospects seriously?</p>
<!-- /wp:paragraph -->
<!-- wp:paragraph -->
<p>A human-level AI would be a machine, or a network of machines, capable of carrying out the same range of tasks that we humans are capable of. It would be a machine that is “able to learn to do anything that a human can do”, as Norvig and Russell put it in their textbook on AI.{ref}Peter Norvig and Stuart Russell (2021) – Artificial Intelligence: A Modern Approach. Fourth edition. Published by Pearson.{/ref}</p>
<!-- /wp:paragraph -->
<!-- wp:paragraph -->
<p>It would be able to choose actions that allow the machine to achieve its goals and then carry out those actions. It would be able to do the work of a translator, a doctor, an illustrator, a teacher, a therapist, a driver, or the work of an investor. </p>
<!-- /wp:paragraph -->
<!-- wp:paragraph -->
<p>In recent years, several research teams contacted AI experts and asked them about their expectations for the future of machine intelligence. Such expert surveys are one of the pieces of information that we can rely on to form an idea of what the future of AI might look like.</p>
<!-- /wp:paragraph -->
<!-- wp:paragraph -->
<p>The chart shows the answers of 352 experts. This is from the most recent study by Katja Grace and her co… |
{"id": "wp-54836", "slug": "ai-timelines", "content": {"toc": [], "body": [{"type": "text", "value": [{"text": "Our World in Data presents the data and research to make progress against the world’s largest problems.", "spanType": "span-simple-text"}, {"spanType": "span-newline"}, {"text": "This article draws on data and research discussed in our entry on ", "spanType": "span-simple-text"}, {"children": [{"url": "https://ourworldindata.org/artificial-intelligence", "children": [{"text": "Artificial Intelligence", "spanType": "span-simple-text"}], "spanType": "span-link"}], "spanType": "span-bold"}, {"text": ".", "spanType": "span-simple-text"}], "parseErrors": []}, {"type": "text", "value": [{"text": "Artificial intelligence (AI) that surpasses our own intelligence sounds like the stuff from science-fiction books or films. What do experts in the field of AI research think about such scenarios? Do they dismiss these ideas as fantasy, or are they taking such prospects seriously?", "spanType": "span-simple-text"}], "parseErrors": []}, {"type": "text", "value": [{"text": "A human-level AI would be a machine, or a network of machines, capable of carrying out the same range of tasks that we humans are capable of. It would be a machine that is “able to learn to do anything that a human can do”, as Norvig and Russell put it in their textbook on AI.{ref}Peter Norvig and Stuart Russell (2021) – Artificial Intelligence: A Modern Approach. Fourth edition. Published by Pearson.{/ref}", "spanType": "span-simple-text"}], "parseErrors": []}, {"type": "text", "value": [{"text": "It would be able to choose actions that allow the machine to achieve its goals and then carry out those actions. It would be able to do the work of a translator, a doctor, an illustrator, a teacher, a therapist, a driver, or the work of an investor. ", "spanType": "span-simple-text"}], "parseErrors": []}, {"type": "text", "value": [{"text": "In recent years, several research teams contacted AI experts and asked them about their expectations for the future … | {"errors": [{"name": "unexpected wp component tag", "details": "Found unhandled wp:comment tag image"}, {"name": "unexpected wp component tag", "details": "Found unhandled wp:comment tag image"}, {"name": "unexpected wp component tag", "details": "Found unhandled wp:comment tag image"}, {"name": "unexpected wp component tag", "details": "Found unhandled wp:comment tag list"}, {"name": "unexpected wp component tag", "details": "Found unhandled wp:comment tag list"}, {"name": "unhandled html tag found", "details": "Encountered the unhandled tag hr"}, {"name": "unexpected wp component tag", "details": "Found unhandled wp:comment tag separator"}, {"name": "unexpected wp component tag", "details": "Found unhandled wp:comment tag spacer"}, {"name": "unhandled html tag found", "details": "Encountered the unhandled tag hr"}, {"name": "unexpected wp component tag", "details": "Found unhandled wp:comment tag separator"}], "numBlocks": 47, "numErrors": 10, "wpTagCounts": {"html": 2, "list": 4, "image": 3, "column": 6, "spacer": 1, "columns": 3, "heading": 10, "paragraph": 68, "separator": 2, "owid/additional-information": 1}, "htmlTagCounts": {"p": 69, "h3": 1, "h4": 4, "h5": 5, "hr": 2, "ol": 2, "ul": 2, "div": 11, "figure": 3}} | 2023-02-07 11:00:00 | 2024-02-16 14:22:54 | 1OznrkRcYj3wrfD8L_JgMlwPs8OeUjBwPN5BMN_v5i9o | ["Max Roser"] | Many AI experts believe there is a real chance that human-level artificial intelligence will be developed within the next decades, and some believe that it will exist much sooner. | 2022-12-02 17:35:18 | 2023-10-11 08:44:20 | https://ourworldindata.org/wp-content/uploads/2022/12/featured-image-When-do-experts-expect-Artificial-General-Intelligence.png | {} | Our World in Data presents the data and research to make progress against the world’s largest problems. This article draws on data and research discussed in our entry on **[Artificial Intelligence](https://ourworldindata.org/artificial-intelligence)**. Artificial intelligence (AI) that surpasses our own intelligence sounds like the stuff from science-fiction books or films. What do experts in the field of AI research think about such scenarios? Do they dismiss these ideas as fantasy, or are they taking such prospects seriously? A human-level AI would be a machine, or a network of machines, capable of carrying out the same range of tasks that we humans are capable of. It would be a machine that is “able to learn to do anything that a human can do”, as Norvig and Russell put it in their textbook on AI.{ref}Peter Norvig and Stuart Russell (2021) – Artificial Intelligence: A Modern Approach. Fourth edition. Published by Pearson.{/ref} It would be able to choose actions that allow the machine to achieve its goals and then carry out those actions. It would be able to do the work of a translator, a doctor, an illustrator, a teacher, a therapist, a driver, or the work of an investor. In recent years, several research teams contacted AI experts and asked them about their expectations for the future of machine intelligence. Such expert surveys are one of the pieces of information that we can rely on to form an idea of what the future of AI might look like. The chart shows the answers of 352 experts. This is from the most recent study by Katja Grace and her colleagues, conducted in the summer of 2022.{ref}A total of 4,271 AI experts were contacted; 738 responded (a 17% rate), of which 352 provided complete answers to the human-level AI question. It’s possible that the respondents were not representative of all the AI experts contacted – that is, that there was “sample bias.” There is not enough data to rule out all potential sources of sample bias. After all, we don’t know what the people who didn’t respond to … | {"id": 54836, "date": "2023-02-07T11:00:00", "guid": {"rendered": "https://owid.cloud/?p=54836"}, "link": "https://owid.cloud/ai-timelines", "meta": {"owid_publication_context_meta_field": {"latest": true, "homepage": true, "immediate_newsletter": true}}, "slug": "ai-timelines", "tags": [], "type": "post", "title": {"rendered": "AI timelines: What do experts in artificial intelligence expect for the future?"}, "_links": {"self": [{"href": "https://owid.cloud/wp-json/wp/v2/posts/54836"}], "about": [{"href": "https://owid.cloud/wp-json/wp/v2/types/post"}], "author": [{"href": "https://owid.cloud/wp-json/wp/v2/users/2", "embeddable": true}], "curies": [{"href": "https://api.w.org/{rel}", "name": "wp", "templated": true}], "replies": [{"href": "https://owid.cloud/wp-json/wp/v2/comments?post=54836", "embeddable": true}], "wp:term": [{"href": "https://owid.cloud/wp-json/wp/v2/categories?post=54836", "taxonomy": "category", "embeddable": true}, {"href": "https://owid.cloud/wp-json/wp/v2/tags?post=54836", "taxonomy": "post_tag", "embeddable": true}], "collection": [{"href": "https://owid.cloud/wp-json/wp/v2/posts"}], "wp:attachment": [{"href": "https://owid.cloud/wp-json/wp/v2/media?parent=54836"}], "version-history": [{"href": "https://owid.cloud/wp-json/wp/v2/posts/54836/revisions", "count": 17}], "wp:featuredmedia": [{"href": "https://owid.cloud/wp-json/wp/v2/media/54859", "embeddable": true}], "predecessor-version": [{"id": 58295, "href": "https://owid.cloud/wp-json/wp/v2/posts/54836/revisions/58295"}]}, "author": 2, "format": "standard", "status": "publish", "sticky": false, "content": {"rendered": "\n<div class=\"blog-info\">\n<p>Our World in Data presents the data and research to make progress against the world’s largest problems.<br>This article draws on data and research discussed in our entry on <strong><a href=\"https://ourworldindata.org/artificial-intelligence\" target=\"_blank\" rel=\"noopener\">Artificial Intelligence</a></strong>.</p>\n</div>\n\n\n\n<div class=\"wp-block-columns\">\n<div class=\"wp-block-… |
| 1164 | 1164 | 54814 | Artificial intelligence has advanced despite having few resources dedicated to its development – now investments have increased substantially | ai-investments | post | publish | <!-- wp:html -->
<div class="blog-info">
<p>Our World in Data presents the data and research to make progress against the world’s largest problems.<br>This article draws on data and research discussed in our entry on <strong><a href="https://ourworldindata.org/artificial-intelligence" target="_blank" rel="noopener">Artificial Intelligence</a></strong>.</p>
</div>
<!-- /wp:html -->
<!-- wp:paragraph -->
<p>Artificial intelligence (AI) technology has steadily become more powerful over the course of the last decades and in recent years it has entered our world in many different domains. In a companion article – <a href="https://ourworldindata.org/brief-history-of-ai">the brief history of artificial intelligence</a> – I document this development.</p>
<!-- /wp:paragraph -->
<!-- wp:paragraph -->
<p>This was achieved despite having relatively few resources. Until recently, investments in terms of capital and scientific efforts were small. In this article I highlight that this has very much changed in recent years. Corporate investment has increased and the scientific field has grown in size.</p>
<!-- /wp:paragraph -->
<!-- wp:paragraph -->
<p>Given how rapidly AI developed in the past, despite the limited resources, this should make us expect AI technology to continue to become more powerful in the coming decades. </p>
<!-- /wp:paragraph -->
<!-- wp:heading {"level":4} -->
<h4>Investments into AI</h4>
<!-- /wp:heading -->
<!-- wp:paragraph -->
<p>The first chart looks at corporate investment over time.{ref}It is not obvious how to adjust a time-series of AI investments for inflation, and we debated it at some length within the team. </p>
<!-- /wp:paragraph -->
<!-- wp:paragraph -->
<p>Reporting it in nominal prices (as some do) means it makes little sense to compare observations across time and is therefore not very helpful. To make comparisons over time possible one has to take into account that prices change.</p>
<!-- /wp:paragraph -->
<!-- wp:paragraph -->
<p>It would be straightforward to adjust th… |
{"id": "wp-54814", "slug": "ai-investments", "content": {"toc": [], "body": [{"type": "text", "value": [{"text": "Our World in Data presents the data and research to make progress against the world’s largest problems.", "spanType": "span-simple-text"}, {"spanType": "span-newline"}, {"text": "This article draws on data and research discussed in our entry on ", "spanType": "span-simple-text"}, {"children": [{"url": "https://ourworldindata.org/artificial-intelligence", "children": [{"text": "Artificial Intelligence", "spanType": "span-simple-text"}], "spanType": "span-link"}], "spanType": "span-bold"}, {"text": ".", "spanType": "span-simple-text"}], "parseErrors": []}, {"type": "text", "value": [{"text": "Artificial intelligence (AI) technology has steadily become more powerful over the course of the last decades and in recent years it has entered our world in many different domains. In a companion article – ", "spanType": "span-simple-text"}, {"url": "https://ourworldindata.org/brief-history-of-ai", "children": [{"text": "the brief history of artificial intelligence", "spanType": "span-simple-text"}], "spanType": "span-link"}, {"text": " – I document this development.", "spanType": "span-simple-text"}], "parseErrors": []}, {"type": "text", "value": [{"text": "This was achieved despite having relatively few resources. Until recently, investments in terms of capital and scientific efforts were small. In this article I highlight that this has very much changed in recent years. Corporate investment has increased and the scientific field has grown in size.", "spanType": "span-simple-text"}], "parseErrors": []}, {"type": "text", "value": [{"text": "Given how rapidly AI developed in the past, despite the limited resources, this should make us expect AI technology to continue to become more powerful in the coming decades. ", "spanType": "span-simple-text"}], "parseErrors": []}, {"text": [{"text": "Investments into AI", "spanType": "span-simple-text"}], "type": "heading", "level": 2, "parseErrors": []}, {"type": "text", "va… | {"errors": [{"name": "unhandled html tag found", "details": "Encountered the unhandled tag hr"}, {"name": "unexpected wp component tag", "details": "Found unhandled wp:comment tag separator"}, {"name": "unexpected wp component tag", "details": "Found unhandled wp:comment tag spacer"}, {"name": "unhandled html tag found", "details": "Encountered the unhandled tag hr"}, {"name": "unexpected wp component tag", "details": "Found unhandled wp:comment tag separator"}, {"name": "unexpected wp component tag", "details": "Found unhandled wp:comment tag spacer"}, {"name": "prominent link missing title", "details": "Prominent link is missing a title attribute"}, {"name": "prominent link missing title", "details": "Prominent link is missing a title attribute"}, {"name": "prominent link missing title", "details": "Prominent link is missing a title attribute"}], "numBlocks": 28, "numErrors": 9, "wpTagCounts": {"html": 6, "column": 4, "spacer": 2, "columns": 2, "heading": 3, "paragraph": 22, "separator": 2, "owid/prominent-link": 3}, "htmlTagCounts": {"p": 23, "h4": 3, "hr": 2, "div": 9, "iframe": 5}} | 2023-03-29 09:00:00 | 2024-02-16 14:22:55 | 1IRkR6ijZ2nvYqhqe8BXBtAnZAbo5NGDcLX4CW3oEXnY | ["Max Roser"] | In the past, relatively few researchers were working on AI technology and there was little commercial interest and funding. Now, the available resources have increased substantially. We should expect that the field continues to advance rapidly. | 2022-12-02 17:21:04 | 2023-10-11 08:43:56 | https://ourworldindata.org/wp-content/uploads/2022/12/featured-image-on-ai-investments.png | {} | Our World in Data presents the data and research to make progress against the world’s largest problems. This article draws on data and research discussed in our entry on **[Artificial Intelligence](https://ourworldindata.org/artificial-intelligence)**. Artificial intelligence (AI) technology has steadily become more powerful over the course of the last decades and in recent years it has entered our world in many different domains. In a companion article – [the brief history of artificial intelligence](https://ourworldindata.org/brief-history-of-ai) – I document this development. This was achieved despite having relatively few resources. Until recently, investments in terms of capital and scientific efforts were small. In this article I highlight that this has very much changed in recent years. Corporate investment has increased and the scientific field has grown in size. Given how rapidly AI developed in the past, despite the limited resources, this should make us expect AI technology to continue to become more powerful in the coming decades. ## Investments into AI The first chart looks at corporate investment over time.{ref}It is not obvious how to adjust a time-series of AI investments for inflation, and we debated it at some length within the team. Reporting it in nominal prices (as some do) means it makes little sense to compare observations across time and is therefore not very helpful. To make comparisons over time possible one has to take into account that prices change. It would be straightforward to adjust the time series for price changes if we knew the prices of the specific goods and services that these investments purchased. This would make it possible to calculate a volume measure of AI investments, and it would tell us how much these investments bought. But such a metric is not available. (While a comprehensive price index is not available, we know that the cost for some crucial AI technology has fallen rapidly in price. For example, it has become much cheaper to train an AI system.) I… | {"id": 54814, "date": "2023-03-29T10:00:00", "guid": {"rendered": "https://owid.cloud/?p=54814"}, "link": "https://owid.cloud/ai-investments", "meta": {"owid_publication_context_meta_field": {"latest": true, "homepage": true, "immediate_newsletter": true}}, "slug": "ai-investments", "tags": [], "type": "post", "title": {"rendered": "Artificial intelligence has advanced despite having few resources dedicated to its development – now investments have increased substantially"}, "_links": {"self": [{"href": "https://owid.cloud/wp-json/wp/v2/posts/54814"}], "about": [{"href": "https://owid.cloud/wp-json/wp/v2/types/post"}], "author": [{"href": "https://owid.cloud/wp-json/wp/v2/users/2", "embeddable": true}], "curies": [{"href": "https://api.w.org/{rel}", "name": "wp", "templated": true}], "replies": [{"href": "https://owid.cloud/wp-json/wp/v2/comments?post=54814", "embeddable": true}], "wp:term": [{"href": "https://owid.cloud/wp-json/wp/v2/categories?post=54814", "taxonomy": "category", "embeddable": true}, {"href": "https://owid.cloud/wp-json/wp/v2/tags?post=54814", "taxonomy": "post_tag", "embeddable": true}], "collection": [{"href": "https://owid.cloud/wp-json/wp/v2/posts"}], "wp:attachment": [{"href": "https://owid.cloud/wp-json/wp/v2/media?parent=54814"}], "version-history": [{"href": "https://owid.cloud/wp-json/wp/v2/posts/54814/revisions", "count": 20}], "wp:featuredmedia": [{"href": "https://owid.cloud/wp-json/wp/v2/media/54829", "embeddable": true}], "predecessor-version": [{"id": 58294, "href": "https://owid.cloud/wp-json/wp/v2/posts/54814/revisions/58294"}]}, "author": 2, "format": "standard", "status": "publish", "sticky": false, "content": {"rendered": "\n<div class=\"blog-info\">\n<p>Our World in Data presents the data and research to make progress against the world’s largest problems.<br>This article draws on data and research discussed in our entry on <strong><a href=\"https://ourworldindata.org/artificial-intelligence\" target=\"_blank\" rel=\"noopener\">Artificial Intelligence</a></strong>.</p>\n</di… |
| 1163 | 1163 | 54765 | The brief history of artificial intelligence: The world has changed fast – what might be next? | brief-history-of-ai | post | publish | <!-- wp:html -->
<div class="blog-info">
<p>Our World in Data presents the data and research to make progress against the world’s largest problems.<br>This article draws on data and research discussed in our entry on <strong><a href="https://ourworldindata.org/artificial-intelligence" target="_blank" rel="noopener">Artificial Intelligence</a></strong>.</p>
</div>
<!-- /wp:html -->
<!-- wp:paragraph -->
<p>To see what the future might look like it is often helpful to study our history. This is what I will do in this article. I retrace the brief history of computers and artificial intelligence to see what we can expect for the future.</p>
<!-- /wp:paragraph -->
<!-- wp:heading {"level":4} -->
<h4>How did we get here?</h4>
<!-- /wp:heading -->
<!-- wp:columns -->
<div class="wp-block-columns"><!-- wp:column -->
<div class="wp-block-column"><!-- wp:paragraph -->
<p>How rapidly the world has changed becomes clear by how even quite recent computer technology feels ancient to us today. Mobile phones in the ‘90s were big bricks with tiny green displays. Two decades before that the main storage for computers was punch cards. </p>
<!-- /wp:paragraph -->
<!-- wp:paragraph -->
<p>In a short period computers evolved so quickly and became such an integral part of our daily lives that it is easy to forget how recent this technology is. The first digital computers were only invented about eight decades ago, as the timeline shows.</p>
<!-- /wp:paragraph --></div>
<!-- /wp:column -->
<!-- wp:column -->
<div class="wp-block-column"></div>
<!-- /wp:column --></div>
<!-- /wp:columns -->
<!-- wp:image {"id":54772,"sizeSlug":"full","linkDestination":"none"} -->
<figure class="wp-block-image size-full"><img src="https://owid.cloud/app/uploads/2022/12/Computer-timeline.png" alt="" class="wp-image-54772"/></figure>
<!-- /wp:image -->
<!-- wp:columns -->
<div class="wp-block-columns"><!-- wp:column -->
<div class="wp-block-column"><!-- wp:paragraph -->
<p>Since the early days of this history, some computer scientists have striv… |
{"id": "wp-54765", "slug": "brief-history-of-ai", "content": {"toc": [], "body": [{"type": "text", "value": [{"text": "Our World in Data presents the data and research to make progress against the world’s largest problems.", "spanType": "span-simple-text"}, {"spanType": "span-newline"}, {"text": "This article draws on data and research discussed in our entry on ", "spanType": "span-simple-text"}, {"children": [{"url": "https://ourworldindata.org/artificial-intelligence", "children": [{"text": "Artificial Intelligence", "spanType": "span-simple-text"}], "spanType": "span-link"}], "spanType": "span-bold"}, {"text": ".", "spanType": "span-simple-text"}], "parseErrors": []}, {"type": "text", "value": [{"text": "To see what the future might look like it is often helpful to study our history. This is what I will do in this article. I retrace the brief history of computers and artificial intelligence to see what we can expect for the future.", "spanType": "span-simple-text"}], "parseErrors": []}, {"text": [{"text": "How did we get here?", "spanType": "span-simple-text"}], "type": "heading", "level": 3, "parseErrors": []}, {"type": "text", "value": [{"text": "How rapidly the world has changed becomes clear by how even quite recent computer technology feels ancient to us today. Mobile phones in the ‘90s were big bricks with tiny green displays. Two decades before that the main storage for computers was punch cards. ", "spanType": "span-simple-text"}], "parseErrors": []}, {"type": "text", "value": [{"text": "In a short period computers evolved so quickly and became such an integral part of our daily lives that it is easy to forget how recent this technology is. The first digital computers were only invented about eight decades ago, as the timeline shows.", "spanType": "span-simple-text"}], "parseErrors": []}, {"alt": "", "size": "wide", "type": "image", "filename": "Computer-timeline.png", "parseErrors": []}, {"type": "text", "value": [{"text": "Since the early days of this history, some computer scientists have strived to… | {"errors": [{"name": "unexpected wp component tag", "details": "Found unhandled wp:comment tag image"}, {"name": "unexpected wp component tag", "details": "Found unhandled wp:comment tag image"}, {"name": "unexpected wp component tag", "details": "Found unhandled wp:comment tag image"}, {"name": "unexpected wp component tag", "details": "Found unhandled wp:comment tag image"}, {"name": "unexpected wp component tag", "details": "Found unhandled wp:comment tag image"}, {"name": "unexpected wp component tag", "details": "Found unhandled wp:comment tag image"}, {"name": "unhandled html tag found", "details": "Encountered the unhandled tag hr"}, {"name": "unexpected wp component tag", "details": "Found unhandled wp:comment tag separator"}, {"name": "unexpected wp component tag", "details": "Found unhandled wp:comment tag spacer"}], "numBlocks": 45, "numErrors": 9, "wpTagCounts": {"html": 1, "image": 6, "column": 12, "spacer": 1, "columns": 6, "heading": 8, "paragraph": 71, "separator": 1}, "htmlTagCounts": {"p": 72, "h3": 2, "h4": 6, "hr": 1, "div": 20, "figure": 6}} | 2022-12-06 01:00:00 | 2024-02-16 14:22:54 | 1WGJaY95A4hVjybBPzHOA80iGygKUKcgx0kSs-G_b7aA | ["Max Roser"] | Despite their brief history, computers and AI have fundamentally changed what we see, what we know, and what we do. Little is as important for the future of the world, and our own lives, as how this history continues. | 2022-12-02 12:33:16 | 2023-07-31 13:05:20 | https://ourworldindata.org/wp-content/uploads/2022/12/featured-image-ai-training-computation.png | {} | Our World in Data presents the data and research to make progress against the world’s largest problems. This article draws on data and research discussed in our entry on **[Artificial Intelligence](https://ourworldindata.org/artificial-intelligence)**. To see what the future might look like it is often helpful to study our history. This is what I will do in this article. I retrace the brief history of computers and artificial intelligence to see what we can expect for the future. ### How did we get here? How rapidly the world has changed becomes clear by how even quite recent computer technology feels ancient to us today. Mobile phones in the ‘90s were big bricks with tiny green displays. Two decades before that the main storage for computers was punch cards. In a short period computers evolved so quickly and became such an integral part of our daily lives that it is easy to forget how recent this technology is. The first digital computers were only invented about eight decades ago, as the timeline shows. <Image filename="Computer-timeline.png" alt=""/> Since the early days of this history, some computer scientists have strived to make machines as intelligent as humans. The next timeline shows some of the notable artificial intelligence (AI) systems and describes what they were capable of. The first system I mention is the Theseus. It was built by Claude Shannon in 1950 and was a remote-controlled mouse that was able to find its way out of a labyrinth and could remember its course.{ref}On the Theseus see Daniel Klein (2019) – [Mighty mouse](https://web.archive.org/web/20220125004420/https://www.technologyreview.com/2018/12/19/138508/mighty-mouse/), Published in MIT Technology Review. And [this video on YouTube](https://www.youtube.com/watch?v=_9_AEVQ_p74) of a presentation by its inventor Claude Shannon.{/ref} In seven decades the abilities of artificial intelligence have come a long way. <Image filename="ai-timeline.png" alt=""/> ### The language and image recognition capabilities of AI systems have… | {"id": 54765, "date": "2022-12-06T01:00:00", "guid": {"rendered": "https://owid.cloud/?p=54765"}, "link": "https://owid.cloud/brief-history-of-ai", "meta": {"owid_publication_context_meta_field": {"latest": true, "homepage": true, "immediate_newsletter": true}}, "slug": "brief-history-of-ai", "tags": [], "type": "post", "title": {"rendered": "The brief history of artificial intelligence: The world has changed fast – what might be next?"}, "_links": {"self": [{"href": "https://owid.cloud/wp-json/wp/v2/posts/54765"}], "about": [{"href": "https://owid.cloud/wp-json/wp/v2/types/post"}], "author": [{"href": "https://owid.cloud/wp-json/wp/v2/users/2", "embeddable": true}], "curies": [{"href": "https://api.w.org/{rel}", "name": "wp", "templated": true}], "replies": [{"href": "https://owid.cloud/wp-json/wp/v2/comments?post=54765", "embeddable": true}], "wp:term": [{"href": "https://owid.cloud/wp-json/wp/v2/categories?post=54765", "taxonomy": "category", "embeddable": true}, {"href": "https://owid.cloud/wp-json/wp/v2/tags?post=54765", "taxonomy": "post_tag", "embeddable": true}], "collection": [{"href": "https://owid.cloud/wp-json/wp/v2/posts"}], "wp:attachment": [{"href": "https://owid.cloud/wp-json/wp/v2/media?parent=54765"}], "version-history": [{"href": "https://owid.cloud/wp-json/wp/v2/posts/54765/revisions", "count": 29}], "wp:featuredmedia": [{"href": "https://owid.cloud/wp-json/wp/v2/media/54806", "embeddable": true}], "predecessor-version": [{"id": 57947, "href": "https://owid.cloud/wp-json/wp/v2/posts/54765/revisions/57947"}]}, "author": 2, "format": "standard", "status": "publish", "sticky": false, "content": {"rendered": "\n<div class=\"blog-info\">\n<p>Our World in Data presents the data and research to make progress against the world’s largest problems.<br>This article draws on data and research discussed in our entry on <strong><a href=\"https://ourworldindata.org/artificial-intelligence\" target=\"_blank\" rel=\"noopener\">Artificial Intelligence</a></strong>.</p>\n</div>\n\n\n\n<p>To see what the future m… |
| 1162 | 1162 | 54759 | Artificial intelligence is transforming our world — it is on all of us to make sure that it goes well | ai-impact | post | publish | <!-- wp:html -->
<div class="blog-info">
<p>Our World in Data presents the data and research to make progress against the world’s largest problems.<br>This article draws on data and research discussed in our entry on <strong><a href="https://ourworldindata.org/artificial-intelligence" target="_blank" rel="noopener">Artificial Intelligence</a></strong>.</p>
</div>
<!-- /wp:html -->
<!-- wp:paragraph -->
<p>Why should you care about the development of artificial intelligence?</p>
<!-- /wp:paragraph -->
<!-- wp:paragraph -->
<p>Think about what the alternative would look like. If you and the wider public do not get informed and engaged, then we leave it to a few entrepreneurs and engineers to decide how this technology will transform our world.</p>
<!-- /wp:paragraph -->
<!-- wp:paragraph -->
<p>That is the status quo. This small number of people at a few tech firms directly working on artificial intelligence (AI) do understand how extraordinarily powerful this technology is <a href="https://ourworldindata.org/brief-history-of-ai">becoming</a>. If the rest of society does not become engaged, then it will be this small elite who decides how this technology will change our lives.</p>
<!-- /wp:paragraph -->
<!-- wp:paragraph -->
<p>To change this status quo, I want to answer three questions in this article: Why is it hard to take the prospect of a world transformed by AI seriously? How can we imagine such a world? And what is at stake as this technology becomes more powerful?</p>
<!-- /wp:paragraph -->
<!-- wp:heading {"level":4} -->
<h4>Why is it hard to take the prospect of a world transformed by artificial intelligence seriously?</h4>
<!-- /wp:heading -->
<!-- wp:paragraph -->
<p>In some way, it should be obvious how technology can fundamentally transform the world. We just have to look at how much the world has already changed. If you could invite a family of hunter-gatherers from 20,000 years ago on your next flight, they would be pretty surprised. Technology has changed our world already, so we should expec… |
{"id": "wp-54759", "slug": "ai-impact", "content": {"toc": [], "body": [{"type": "text", "value": [{"text": "Our World in Data presents the data and research to make progress against the world’s largest problems.", "spanType": "span-simple-text"}, {"spanType": "span-newline"}, {"text": "This article draws on data and research discussed in our entry on ", "spanType": "span-simple-text"}, {"children": [{"url": "https://ourworldindata.org/artificial-intelligence", "children": [{"text": "Artificial Intelligence", "spanType": "span-simple-text"}], "spanType": "span-link"}], "spanType": "span-bold"}, {"text": ".", "spanType": "span-simple-text"}], "parseErrors": []}, {"type": "text", "value": [{"text": "Why should you care about the development of artificial intelligence?", "spanType": "span-simple-text"}], "parseErrors": []}, {"type": "text", "value": [{"text": "Think about what the alternative would look like. If you and the wider public do not get informed and engaged, then we leave it to a few entrepreneurs and engineers to decide how this technology will transform our world.", "spanType": "span-simple-text"}], "parseErrors": []}, {"type": "text", "value": [{"text": "That is the status quo. This small number of people at a few tech firms directly working on artificial intelligence (AI) do understand how extraordinarily powerful this technology is ", "spanType": "span-simple-text"}, {"url": "https://ourworldindata.org/brief-history-of-ai", "children": [{"text": "becoming", "spanType": "span-simple-text"}], "spanType": "span-link"}, {"text": ". If the rest of society does not become engaged, then it will be this small elite who decides how this technology will change our lives.", "spanType": "span-simple-text"}], "parseErrors": []}, {"type": "text", "value": [{"text": "To change this status quo, I want to answer three questions in this article: Why is it hard to take the prospect of a world transformed by AI seriously? How can we imagine such a world? And what is at stake as this technology becomes more powerful?", "… | {"errors": [{"name": "unexpected wp component tag", "details": "Found unhandled wp:comment tag image"}, {"name": "unexpected wp component tag", "details": "Found unhandled wp:comment tag image"}, {"name": "unhandled html tag found", "details": "Encountered the unhandled tag hr"}, {"name": "unexpected wp component tag", "details": "Found unhandled wp:comment tag separator"}, {"name": "unexpected wp component tag", "details": "Found unhandled wp:comment tag spacer"}], "numBlocks": 69, "numErrors": 5, "wpTagCounts": {"html": 1, "image": 2, "column": 4, "spacer": 1, "columns": 2, "heading": 7, "paragraph": 59, "separator": 1}, "htmlTagCounts": {"p": 60, "h4": 4, "h5": 3, "hr": 1, "div": 8, "figure": 2}} | 2022-12-15 05:00:00 | 2024-02-16 14:22:54 | 1rzaBWNe1jarUZIhWvqJOB3Om4RzgJ1rlYu20Ic7O5Og | ["Max Roser"] | How AI gets built is currently decided by a small group of technologists. As this technology is transforming our lives, it should be in all of our interest to become informed and engaged. | 2022-12-02 12:25:34 | 2023-10-11 08:43:04 | https://ourworldindata.org/wp-content/uploads/2022/12/featured-image-Timeline-of-Transformative-Events-1.png | {} | Our World in Data presents the data and research to make progress against the world’s largest problems. This article draws on data and research discussed in our entry on **[Artificial Intelligence](https://ourworldindata.org/artificial-intelligence)**. Why should you care about the development of artificial intelligence? Think about what the alternative would look like. If you and the wider public do not get informed and engaged, then we leave it to a few entrepreneurs and engineers to decide how this technology will transform our world. That is the status quo. This small number of people at a few tech firms directly working on artificial intelligence (AI) do understand how extraordinarily powerful this technology is [becoming](https://ourworldindata.org/brief-history-of-ai). If the rest of society does not become engaged, then it will be this small elite who decides how this technology will change our lives. To change this status quo, I want to answer three questions in this article: Why is it hard to take the prospect of a world transformed by AI seriously? How can we imagine such a world? And what is at stake as this technology becomes more powerful? ## Why is it hard to take the prospect of a world transformed by artificial intelligence seriously? In some way, it should be obvious how technology can fundamentally transform the world. We just have to look at how much the world has already changed. If you could invite a family of hunter-gatherers from 20,000 years ago on your next flight, they would be pretty surprised. Technology has changed our world already, so we should expect that it can happen again. But while we have seen the world transform before, we have seen these transformations play out over the course of generations. What is different now is how very rapid these technological changes have become. In the past, the technologies that our ancestors used in their childhood were still central to their lives in their old age. This has not been the case anymore for recent generations. Instead, it… | {"id": 54759, "date": "2022-12-15T05:00:00", "guid": {"rendered": "https://owid.cloud/?p=54759"}, "link": "https://owid.cloud/ai-impact", "meta": {"owid_publication_context_meta_field": {"latest": true, "homepage": true, "immediate_newsletter": true}}, "slug": "ai-impact", "tags": [], "type": "post", "title": {"rendered": "Artificial intelligence is transforming our world — it is on all of us to make sure that it goes well"}, "_links": {"self": [{"href": "https://owid.cloud/wp-json/wp/v2/posts/54759"}], "about": [{"href": "https://owid.cloud/wp-json/wp/v2/types/post"}], "author": [{"href": "https://owid.cloud/wp-json/wp/v2/users/2", "embeddable": true}], "curies": [{"href": "https://api.w.org/{rel}", "name": "wp", "templated": true}], "replies": [{"href": "https://owid.cloud/wp-json/wp/v2/comments?post=54759", "embeddable": true}], "wp:term": [{"href": "https://owid.cloud/wp-json/wp/v2/categories?post=54759", "taxonomy": "category", "embeddable": true}, {"href": "https://owid.cloud/wp-json/wp/v2/tags?post=54759", "taxonomy": "post_tag", "embeddable": true}], "collection": [{"href": "https://owid.cloud/wp-json/wp/v2/posts"}], "wp:attachment": [{"href": "https://owid.cloud/wp-json/wp/v2/media?parent=54759"}], "version-history": [{"href": "https://owid.cloud/wp-json/wp/v2/posts/54759/revisions", "count": 19}], "wp:featuredmedia": [{"href": "https://owid.cloud/wp-json/wp/v2/media/54894", "embeddable": true}], "predecessor-version": [{"id": 58291, "href": "https://owid.cloud/wp-json/wp/v2/posts/54759/revisions/58291"}]}, "author": 2, "format": "standard", "status": "publish", "sticky": false, "content": {"rendered": "\n<div class=\"blog-info\">\n<p>Our World in Data presents the data and research to make progress against the world’s largest problems.<br>This article draws on data and research discussed in our entry on <strong><a href=\"https://ourworldindata.org/artificial-intelligence\" target=\"_blank\" rel=\"noopener\">Artificial Intelligence</a></strong>.</p>\n</div>\n\n\n\n<p>Why should you care about the develop… |
| 1161 | 1161 | 54733 | We published a redesign of our work on the Environmental Impacts of Food | redesign-environmental-impacts-food | post | publish | {"id": "wp-54733", "slug": "redesign-environmental-impacts-food", "content": {"toc": [], "body": [], "type": "article", "title": "We published a redesign of our work on the Environmental Impacts of Food", "authors": ["Hannah Ritchie", "Pablo Rosado"], "excerpt": "We published a major redesign of our work on the Environmental Impacts of Food. Explore all of our data and research in one place.", "dateline": "February 23, 2023", "subtitle": "We published a major redesign of our work on the Environmental Impacts of Food. Explore all of our data and research in one place.", "sidebar-toc": false, "featured-image": "Environmental-Impacts-of-Food-Production-Thumbnail.png"}, "createdAt": "2022-12-02T05:31:12.000Z", "published": false, "updatedAt": "2023-07-10T16:19:02.000Z", "revisionId": null, "publishedAt": "2023-02-23T12:00:00.000Z", "relatedCharts": [], "publicationContext": "listed"} | {"errors": [], "numBlocks": 0, "numErrors": 0, "wpTagCounts": {}, "htmlTagCounts": {}} | 2023-02-23 12:00:00 | 2024-02-16 14:22:54 | ["Hannah Ritchie", "Pablo Rosado"] | We published a major redesign of our work on the Environmental Impacts of Food. Explore all of our data and research in one place. | 2022-12-02 05:31:12 | 2023-07-10 16:19:02 | https://ourworldindata.org/wp-content/uploads/2022/11/Environmental-Impacts-of-Food-Production-Thumbnail.png | {} | {"id": 54733, "date": "2023-02-23T12:00:00", "guid": {"rendered": "https://owid.cloud/?p=54733"}, "link": "https://owid.cloud/redesign-environmental-impacts-food", "meta": {"owid_publication_context_meta_field": {"latest": true, "homepage": true, "immediate_newsletter": true}}, "slug": "redesign-environmental-impacts-food", "tags": [], "type": "post", "title": {"rendered": "We published a redesign of our work on the Environmental Impacts of Food"}, "_links": {"self": [{"href": "https://owid.cloud/wp-json/wp/v2/posts/54733"}], "about": [{"href": "https://owid.cloud/wp-json/wp/v2/types/post"}], "author": [{"href": "https://owid.cloud/wp-json/wp/v2/users/17", "embeddable": true}], "curies": [{"href": "https://api.w.org/{rel}", "name": "wp", "templated": true}], "replies": [{"href": "https://owid.cloud/wp-json/wp/v2/comments?post=54733", "embeddable": true}], "wp:term": [{"href": "https://owid.cloud/wp-json/wp/v2/categories?post=54733", "taxonomy": "category", "embeddable": true}, {"href": "https://owid.cloud/wp-json/wp/v2/tags?post=54733", "taxonomy": "post_tag", "embeddable": true}], "collection": [{"href": "https://owid.cloud/wp-json/wp/v2/posts"}], "wp:attachment": [{"href": "https://owid.cloud/wp-json/wp/v2/media?parent=54733"}], "version-history": [{"href": "https://owid.cloud/wp-json/wp/v2/posts/54733/revisions", "count": 4}], "wp:featuredmedia": [{"href": "https://owid.cloud/wp-json/wp/v2/media/54675", "embeddable": true}], "predecessor-version": [{"id": 56277, "href": "https://owid.cloud/wp-json/wp/v2/posts/54733/revisions/56277"}]}, "author": 17, "format": "standard", "status": "publish", "sticky": false, "content": {"rendered": "", "protected": false}, "excerpt": {"rendered": "We published a major redesign of our work on the Environmental Impacts of Food. Explore all of our data and research in one place.", "protected": false}, "date_gmt": "2023-02-23T12:00:00", "modified": "2023-07-10T17:19:02", "template": "", "categories": [1], "ping_status": "closed", "authors_name": ["Hannah Ritchie", "Pablo Rosado"],… | |||
| 1160 | 1160 | 54697 | The state of the world's elephant populations | elephant-populations | post | publish | <!-- wp-block-tombstone 41927 -->
<!-- wp:paragraph -->
<p>Elephants are the world’s largest living land animals, weighing in at<a href="https://d2ouvy59p0dg6k.cloudfront.net/downloads/african_elephant_factsheet2007w.pdf"> up to 7.5 tonnes</a>.{ref}African elephants are typically bigger than the Asian species. African elephants can weigh up to 7.5 tonnes; Asian elephants<a href="http://wwf.panda.org/knowledge_hub/endangered_species/elephants/asian_elephants/"> up to 5 tonnes</a>.{/ref} </p>
<!-- /wp:paragraph -->
<!-- wp:paragraph -->
<p>Their size has made them a prime target for poaching. History has shown us that it is usually the largest mammals that are most at risk from human hunting. Elephants are no different. We hunt them for their meat, their trunks, and their lucrative tusks.</p>
<!-- /wp:paragraph -->
<!-- wp:paragraph -->
<p>There are around 450,000 elephants in the world. But this is a tiny fraction of how many there used to be.</p>
<!-- /wp:paragraph -->
<!-- wp:paragraph -->
<p>In this article we look at the state of elephant populations, and how these populations have changed over time.</p>
<!-- /wp:paragraph -->
<!-- wp:heading {"level":4} -->
<h4>State of elephant populations today</h4>
<!-- /wp:heading -->
<!-- wp:columns -->
<div class="wp-block-columns"><!-- wp:column -->
<div class="wp-block-column"><!-- wp:paragraph -->
<p>There are two species of elephant: the African (with the official name <em>Loxodonta africana</em>) and the Asian (<em>Elephas maximus</em>) elephant. </p>
<!-- /wp:paragraph -->
<!-- wp:paragraph -->
<p>If you want to tell the difference between them, look at their ears: the African elephant has much bigger ears, very similar in shape to the African continent; the Asian elephant has much smaller, rounded ears.{ref}Elephants dissipate heat via their ears, and so use them for temperature regulation. The reason that African elephants have larger ears is that they live in warmer climates and therefore need to dissipate more heat.{/ref} Their tusks are also a usef… |
{"id": "wp-54697", "slug": "elephant-populations", "content": {"toc": [], "body": [{"type": "text", "value": [{"text": "Elephants are the world’s largest living land animals, weighing in at", "spanType": "span-simple-text"}, {"url": "https://d2ouvy59p0dg6k.cloudfront.net/downloads/african_elephant_factsheet2007w.pdf", "children": [{"text": " up to 7.5 tonnes", "spanType": "span-simple-text"}], "spanType": "span-link"}, {"text": ".{ref}African elephants are typically bigger than the Asian species. African elephants can weigh up to 7.5 tonnes; Asian elephants", "spanType": "span-simple-text"}, {"url": "http://wwf.panda.org/knowledge_hub/endangered_species/elephants/asian_elephants/", "children": [{"text": " up to 5 tonnes", "spanType": "span-simple-text"}], "spanType": "span-link"}, {"text": ".{/ref} ", "spanType": "span-simple-text"}], "parseErrors": []}, {"type": "text", "value": [{"text": "Their size has made them a prime target for poaching. History has shown us that it is usually the largest mammals that are most at risk from human hunting. Elephants are no different. We hunt them for their meat, their trunks, and their lucrative tusks.", "spanType": "span-simple-text"}], "parseErrors": []}, {"type": "text", "value": [{"text": "There are around 450,000 elephants in the world. But this is a tiny fraction of how many there used to be.", "spanType": "span-simple-text"}], "parseErrors": []}, {"type": "text", "value": [{"text": "In this article we look at the state of elephant populations, and how these populations have changed over time.", "spanType": "span-simple-text"}], "parseErrors": []}, {"text": [{"text": "State of elephant populations today", "spanType": "span-simple-text"}], "type": "heading", "level": 3, "parseErrors": []}, {"left": [{"type": "text", "value": [{"text": "There are two species of elephant: the African (with the official name ", "spanType": "span-simple-text"}, {"children": [{"text": "Loxodonta africana", "spanType": "span-simple-text"}], "spanType": "span-italic"}, {"text": ") and the Asian… | {"errors": [{"name": "unexpected wp component tag", "details": "Found unhandled wp:comment tag table"}], "numBlocks": 24, "numErrors": 1, "wpTagCounts": {"html": 3, "table": 1, "column": 6, "columns": 3, "heading": 5, "paragraph": 29}, "htmlTagCounts": {"p": 29, "h3": 2, "h4": 3, "div": 9, "table": 1, "figure": 1, "iframe": 3}} | 2022-12-01 11:55:45 | 2024-03-09 18:34:54 | 1iWmpGe-_tBgDOj09K21Y57kfHFxySSdv8Wt2Ech4rjw | ["Hannah Ritchie"] | How have elephant populations changed over time? What species are at risk of extinction today? | 2022-12-01 11:55:45 | 2022-12-16 13:28:06 | https://ourworldindata.org/wp-content/uploads/2022/11/Elephants.png | {} | Elephants are the world’s largest living land animals, weighing in at[ up to 7.5 tonnes](https://d2ouvy59p0dg6k.cloudfront.net/downloads/african_elephant_factsheet2007w.pdf).{ref}African elephants are typically bigger than the Asian species. African elephants can weigh up to 7.5 tonnes; Asian elephants[ up to 5 tonnes](http://wwf.panda.org/knowledge_hub/endangered_species/elephants/asian_elephants/).{/ref} Their size has made them a prime target for poaching. History has shown us that it is usually the largest mammals that are most at risk from human hunting. Elephants are no different. We hunt them for their meat, their trunks, and their lucrative tusks. There are around 450,000 elephants in the world. But this is a tiny fraction of how many there used to be. In this article we look at the state of elephant populations, and how these populations have changed over time. ### State of elephant populations today There are two species of elephant: the African (with the official name _Loxodonta africana_) and the Asian (_Elephas maximus_) elephant. If you want to tell the difference between them, look at their ears: the African elephant has much bigger ears, very similar in shape to the African continent; the Asian elephant has much smaller, rounded ears.{ref}Elephants dissipate heat via their ears, and so use them for temperature regulation. The reason that African elephants have larger ears is that they live in warmer climates and therefore need to dissipate more heat.{/ref} Their tusks are also a useful indicator: both male and female African elephants can grow tusks, but only male Asian ones can. In the table, I have summarized the status of their populations. There are around ten times as many African than Asian elephants in the world. In 2015, there were[ around 415,000](http://africanelephantdatabase.org/report/2016/Africa) African elephants left. For the Asian species, this is in the range of[ 40,000 to 50,000](http://wwf.panda.org/knowledge_hub/endangered_species/elephants/asian_elephants/). The As… | {"id": 54697, "date": "2022-12-01T11:55:45", "guid": {"rendered": "https://owid.cloud/?p=54697"}, "link": "https://owid.cloud/elephant-populations", "meta": {"owid_publication_context_meta_field": []}, "slug": "elephant-populations", "tags": [], "type": "post", "title": {"rendered": "The state of the world’s elephant populations"}, "_links": {"self": [{"href": "https://owid.cloud/wp-json/wp/v2/posts/54697"}], "about": [{"href": "https://owid.cloud/wp-json/wp/v2/types/post"}], "author": [{"href": "https://owid.cloud/wp-json/wp/v2/users/17", "embeddable": true}], "curies": [{"href": "https://api.w.org/{rel}", "name": "wp", "templated": true}], "replies": [{"href": "https://owid.cloud/wp-json/wp/v2/comments?post=54697", "embeddable": true}], "wp:term": [{"href": "https://owid.cloud/wp-json/wp/v2/categories?post=54697", "taxonomy": "category", "embeddable": true}, {"href": "https://owid.cloud/wp-json/wp/v2/tags?post=54697", "taxonomy": "post_tag", "embeddable": true}], "collection": [{"href": "https://owid.cloud/wp-json/wp/v2/posts"}], "wp:attachment": [{"href": "https://owid.cloud/wp-json/wp/v2/media?parent=54697"}], "version-history": [{"href": "https://owid.cloud/wp-json/wp/v2/posts/54697/revisions", "count": 3}], "wp:featuredmedia": [{"href": "https://owid.cloud/wp-json/wp/v2/media/54668", "embeddable": true}], "predecessor-version": [{"id": 55138, "href": "https://owid.cloud/wp-json/wp/v2/posts/54697/revisions/55138"}]}, "author": 17, "format": "standard", "status": "publish", "sticky": false, "content": {"rendered": "\n<p>Elephants are the world’s largest living land animals, weighing in at<a href=\"https://d2ouvy59p0dg6k.cloudfront.net/downloads/african_elephant_factsheet2007w.pdf\"> up to 7.5 tonnes</a>.{ref}African elephants are typically bigger than the Asian species. African elephants can weigh up to 7.5 tonnes; Asian elephants<a href=\"http://wwf.panda.org/knowledge_hub/endangered_species/elephants/asian_elephants/\"> up to 5 tonnes</a>.{/ref} </p>\n\n\n\n<p>Their size has made them a prime target f… |
| 1159 | 1159 | 54652 | There have been five mass extinctions in Earth's history | mass-extinctions | post | publish | <!-- wp:paragraph -->
<p>There have been five big mass extinctions in Earth's history – these are called the "Big Five". Understanding the reasons and timelines of these events is important to understand the speed and scale of species extinctions today.</p>
<!-- /wp:paragraph -->
<!-- wp:paragraph -->
<p>When and why did these mass extinction events happen?</p>
<!-- /wp:paragraph -->
<!-- wp:heading {"level":3} -->
<h3>What is a mass extinction?</h3>
<!-- /wp:heading -->
<!-- wp:paragraph -->
<p>First, we must be clear on what we mean by "mass extinction". Extinctions are a normal part of evolution: they occur naturally and periodically over time.{ref}Jablonski D (1986) <a href="https://science.sciencemag.org/content/231/4734/129.abstract?casa_token=EoFixpArJnsAAAAA:R4ejNN9Ccy8BjYWiJJMfWUToj6qJSJFQ8jWGiMsL_x2OoBRfsrBdze0p8n6kvYdps25LiL8hcRKwrcy9">Mass and background extinctions: the alternation of macroevolutionary regimes</a>. <em>Science</em> 231:129–133{/ref} </p>
<!-- /wp:paragraph -->
<!-- wp:paragraph -->
<p>There’s a natural background rate to the timing and frequency of extinctions: 10% of species are lost every million years, 30% every 10 million years, and 65% every 100 million years.{ref}Raup DM (1991) <a href="https://scholar.google.com/scholar?hl=en&as_sdt=0%2C5&q=A+Kill+Curve+For+Phanerozoic+Marine+Species+David+M.+Raup+Paleobiology+Vol.+17%2C+No.+1+%28Winter%2C+1991%29%2C+pp.+37-48+%2812+pages%29&btnG=">A kill curve for Phanerozoic marine species</a>. <em>Paleobiology</em>. 17:37–48.{/ref} It would be wrong to assume that species going extinct is out of line with what we would expect. Evolution occurs through the balance of <em>extinction</em> – the end of species – and <em>speciation</em> – the creation of new ones.</p>
<!-- /wp:paragraph -->
<!-- wp:paragraph -->
<p>Extinctions occur periodically at what we would call the "background rate". We can therefore identify periods of history when extinctions were happening much faster than this background rate – this would tell us that … |
{"id": "wp-54652", "slug": "mass-extinctions", "content": {"toc": [], "body": [{"type": "text", "value": [{"text": "There have been five big mass extinctions in Earth's history – these are called the \"Big Five\". Understanding the reasons and timelines of these events is important to understand the speed and scale of species extinctions today.", "spanType": "span-simple-text"}], "parseErrors": []}, {"type": "text", "value": [{"text": "When and why did these mass extinction events happen?", "spanType": "span-simple-text"}], "parseErrors": []}, {"text": [{"text": "What is a mass extinction?", "spanType": "span-simple-text"}], "type": "heading", "level": 2, "parseErrors": []}, {"type": "text", "value": [{"text": "First, we must be clear on what we mean by \"mass extinction\". Extinctions are a normal part of evolution: they occur naturally and periodically over time.{ref}Jablonski D (1986) ", "spanType": "span-simple-text"}, {"url": "https://science.sciencemag.org/content/231/4734/129.abstract?casa_token=EoFixpArJnsAAAAA:R4ejNN9Ccy8BjYWiJJMfWUToj6qJSJFQ8jWGiMsL_x2OoBRfsrBdze0p8n6kvYdps25LiL8hcRKwrcy9", "children": [{"text": "Mass and background extinctions: the alternation of macroevolutionary regimes", "spanType": "span-simple-text"}], "spanType": "span-link"}, {"text": ". ", "spanType": "span-simple-text"}, {"children": [{"text": "Science", "spanType": "span-simple-text"}], "spanType": "span-italic"}, {"text": " 231:129–133{/ref} ", "spanType": "span-simple-text"}], "parseErrors": []}, {"type": "text", "value": [{"text": "There’s a natural background rate to the timing and frequency of extinctions: 10% of species are lost every million years, 30% every 10 million years, and 65% every 100 million years.{ref}Raup DM (1991) ", "spanType": "span-simple-text"}, {"url": "https://scholar.google.com/scholar?hl=en&as_sdt=0%2C5&q=A+Kill+Curve+For+Phanerozoic+Marine+Species+David+M.+Raup+Paleobiology+Vol.+17%2C+No.+1+%28Winter%2C+1991%29%2C+pp.+37-48+%2812+pages%29&btnG=", "children": [{"text": "A kill curve for Phanerozoic… | {"errors": [{"name": "unexpected wp component tag", "details": "Found unhandled wp:comment tag list"}, {"name": "unexpected wp component tag", "details": "Found unhandled wp:comment tag image"}, {"name": "unexpected wp component tag", "details": "Found unhandled wp:comment tag table"}], "numBlocks": 12, "numErrors": 3, "wpTagCounts": {"list": 1, "image": 1, "table": 1, "column": 4, "columns": 2, "heading": 3, "paragraph": 14}, "htmlTagCounts": {"p": 14, "h3": 3, "ol": 1, "div": 6, "table": 1, "figure": 2}} | 2022-11-30 11:54:16 | 2024-03-09 18:21:05 | 1wTcR50pw-YBNbDANNB1oy8ubzy_DiTFcyqBggjSXsBE | ["Hannah Ritchie"] | When did the "Big Five" mass extinctions happen, and what were their causes? | 2022-11-30 11:52:18 | 2023-12-25 16:25:53 | https://ourworldindata.org/wp-content/uploads/2021/03/Extinctions-thumbnail.png | {} | There have been five big mass extinctions in Earth's history – these are called the "Big Five". Understanding the reasons and timelines of these events is important to understand the speed and scale of species extinctions today. When and why did these mass extinction events happen? ## What is a mass extinction? First, we must be clear on what we mean by "mass extinction". Extinctions are a normal part of evolution: they occur naturally and periodically over time.{ref}Jablonski D (1986) [Mass and background extinctions: the alternation of macroevolutionary regimes](https://science.sciencemag.org/content/231/4734/129.abstract?casa_token=EoFixpArJnsAAAAA:R4ejNN9Ccy8BjYWiJJMfWUToj6qJSJFQ8jWGiMsL_x2OoBRfsrBdze0p8n6kvYdps25LiL8hcRKwrcy9). _Science_ 231:129–133{/ref} There’s a natural background rate to the timing and frequency of extinctions: 10% of species are lost every million years, 30% every 10 million years, and 65% every 100 million years.{ref}Raup DM (1991) [A kill curve for Phanerozoic marine species](https://scholar.google.com/scholar?hl=en&as_sdt=0%2C5&q=A+Kill+Curve+For+Phanerozoic+Marine+Species+David+M.+Raup+Paleobiology+Vol.+17%2C+No.+1+%28Winter%2C+1991%29%2C+pp.+37-48+%2812+pages%29&btnG=). _Paleobiology_. 17:37–48.{/ref} It would be wrong to assume that species going extinct is out of line with what we would expect. Evolution occurs through the balance of _extinction_ – the end of species – and _speciation_ – the creation of new ones. Extinctions occur periodically at what we would call the "background rate". We can therefore identify periods of history when extinctions were happening much faster than this background rate – this would tell us that there was an additional environmental or ecological pressure creating more extinctions than we would expect. However, mass extinctions are periods with _much_ higher extinction rates than normal. They are defined by both magnitude and rate. Magnitude is the percentage of species that are lost. Rate is how quickly this happens. These metrics are inevi… | {"id": 54652, "date": "2022-11-30T11:54:16", "guid": {"rendered": "https://owid.cloud/?p=54652"}, "link": "https://owid.cloud/mass-extinctions", "meta": {"owid_publication_context_meta_field": []}, "slug": "mass-extinctions", "tags": [], "type": "post", "title": {"rendered": "There have been five mass extinctions in Earth’s history"}, "_links": {"self": [{"href": "https://owid.cloud/wp-json/wp/v2/posts/54652"}], "about": [{"href": "https://owid.cloud/wp-json/wp/v2/types/post"}], "author": [{"href": "https://owid.cloud/wp-json/wp/v2/users/17", "embeddable": true}], "curies": [{"href": "https://api.w.org/{rel}", "name": "wp", "templated": true}], "replies": [{"href": "https://owid.cloud/wp-json/wp/v2/comments?post=54652", "embeddable": true}], "wp:term": [{"href": "https://owid.cloud/wp-json/wp/v2/categories?post=54652", "taxonomy": "category", "embeddable": true}, {"href": "https://owid.cloud/wp-json/wp/v2/tags?post=54652", "taxonomy": "post_tag", "embeddable": true}], "collection": [{"href": "https://owid.cloud/wp-json/wp/v2/posts"}], "wp:attachment": [{"href": "https://owid.cloud/wp-json/wp/v2/media?parent=54652"}], "version-history": [{"href": "https://owid.cloud/wp-json/wp/v2/posts/54652/revisions", "count": 8}], "wp:featuredmedia": [{"href": "https://owid.cloud/wp-json/wp/v2/media/42157", "embeddable": true}], "predecessor-version": [{"id": 58562, "href": "https://owid.cloud/wp-json/wp/v2/posts/54652/revisions/58562"}]}, "author": 17, "format": "standard", "status": "publish", "sticky": false, "content": {"rendered": "\n<p>There have been five big mass extinctions in Earth’s history – these are called the “Big Five”. Understanding the reasons and timelines of these events is important to understand the speed and scale of species extinctions today.</p>\n\n\n\n<p>When and why did these mass extinction events happen?</p>\n\n\n\n<h3>What is a mass extinction?</h3>\n\n\n\n<p>First, we must be clear on what we mean by “mass extinction”. Extinctions are a normal part of evolution:… |
| 1158 | 1158 | 54648 | How many species are there? | how-many-species-are-there | post | publish | <!-- wp:paragraph -->
<p>How many species do we share our planet with? It's such a basic and fundamental question to understanding the world around us. </p>
<!-- /wp:paragraph -->
<!-- wp:paragraph -->
<p>It's almost unthinkable that we would not know this number or at least have a good estimate. But the truth is that it's a question that continues to escape the world's taxonomists.</p>
<!-- /wp:paragraph -->
<!-- wp:paragraph -->
<p>An important distinction is <strong>how many species we have identified and described</strong> and how many species there actually are. We've only identified a small fraction of the world's species, so these numbers are very different.</p>
<!-- /wp:paragraph -->
<!-- wp:heading {"level":3} -->
<h3>How many species have we <em>described</em>?</h3>
<!-- /wp:heading -->
<!-- wp:columns -->
<div class="wp-block-columns"><!-- wp:column -->
<div class="wp-block-column"><!-- wp:paragraph -->
<p>Before we look at estimates of how many species there are in total, we should first ask the question of how many species we <em>know that we know. </em>Species that we have identified and named.</p>
<!-- /wp:paragraph -->
<!-- wp:paragraph -->
<p>The <a href="https://www.iucnredlist.org/resources/summary-statistics">IUCN Red List</a> tracks the number of described species and updates this figure annually based on the latest work of taxonomists. In 2021, it listed 2.13 million species on the planet. In the chart, we see the breakdown across a range of taxonomic groups – 1.05 million insects, over 11,000 birds, over 11,000 reptiles, and over 6,000 mammals.</p>
<!-- /wp:paragraph -->
<!-- wp:paragraph -->
<p>These figures – particularly for lesser-known groups such as plants or fungi – might be a bit too high. This is because some described species are synonyms – the description of already-known species, simply given a separate name.{ref}Costello, M. J., May, R. M., & Stork, N. E. (2013). Can we name Earth's species before they go extinct?. Science, 339(6118), 413-416.{/ref} There is… |
{"id": "wp-54648", "slug": "how-many-species-are-there", "content": {"toc": [], "body": [{"type": "text", "value": [{"text": "How many species do we share our planet with? It's such a basic and fundamental question to understanding the world around us. ", "spanType": "span-simple-text"}], "parseErrors": []}, {"type": "text", "value": [{"text": "It's almost unthinkable that we would not know this number or at least have a good estimate. But the truth is that it's a question that continues to escape the world's taxonomists.", "spanType": "span-simple-text"}], "parseErrors": []}, {"type": "text", "value": [{"text": "An important distinction is ", "spanType": "span-simple-text"}, {"children": [{"text": "how many species we have identified and described", "spanType": "span-simple-text"}], "spanType": "span-bold"}, {"text": " and how many species there actually are. We've only identified a small fraction of the world's species, so these numbers are very different.", "spanType": "span-simple-text"}], "parseErrors": []}, {"text": [{"text": "How many species have we ", "spanType": "span-simple-text"}, {"children": [{"text": "described", "spanType": "span-simple-text"}], "spanType": "span-italic"}, {"text": "?", "spanType": "span-simple-text"}], "type": "heading", "level": 2, "parseErrors": []}, {"left": [{"type": "text", "value": [{"text": "Before we look at estimates of how many species there are in total, we should first ask the question of how many species we ", "spanType": "span-simple-text"}, {"children": [{"text": "know that we know. ", "spanType": "span-simple-text"}], "spanType": "span-italic"}, {"text": "Species that we have identified and named.", "spanType": "span-simple-text"}], "parseErrors": []}, {"type": "text", "value": [{"text": "The ", "spanType": "span-simple-text"}, {"url": "https://www.iucnredlist.org/resources/summary-statistics", "children": [{"text": "IUCN Red List", "spanType": "span-simple-text"}], "spanType": "span-link"}, {"text": " tracks the number of described species and updates this figure… | {"errors": [{"name": "unexpected wp component tag", "details": "Found unhandled wp:comment tag quote"}, {"name": "unhandled html tag found", "details": "Encountered the unhandled tag hr"}, {"name": "unexpected wp component tag", "details": "Found unhandled wp:comment tag separator"}], "numBlocks": 19, "numErrors": 3, "wpTagCounts": {"html": 1, "quote": 1, "column": 4, "columns": 2, "heading": 2, "paragraph": 21, "separator": 1}, "htmlTagCounts": {"p": 22, "h3": 2, "hr": 1, "div": 6, "iframe": 1, "blockquote": 1}} | 2022-11-30 11:42:49 | 2024-03-09 18:11:26 | 1iHlA_srDqieTz8-l5HHfHdLMRju6BlWQ5FAnXBw5ak8 | ["Hannah Ritchie"] | How many species do we share our planet with? How many of these species have we found and identified? | 2022-11-30 11:42:49 | 2024-02-05 17:42:57 | https://ourworldindata.org/wp-content/uploads/2022/11/Number-of-species-thumbnail.png | {} | How many species do we share our planet with? It's such a basic and fundamental question to understanding the world around us. It's almost unthinkable that we would not know this number or at least have a good estimate. But the truth is that it's a question that continues to escape the world's taxonomists. An important distinction is **how many species we have identified and described** and how many species there actually are. We've only identified a small fraction of the world's species, so these numbers are very different. ## How many species have we _described_? Before we look at estimates of how many species there are in total, we should first ask the question of how many species we _know that we know. _Species that we have identified and named. The [IUCN Red List](https://www.iucnredlist.org/resources/summary-statistics) tracks the number of described species and updates this figure annually based on the latest work of taxonomists. In 2021, it listed 2.13 million species on the planet. In the chart, we see the breakdown across a range of taxonomic groups – 1.05 million insects, over 11,000 birds, over 11,000 reptiles, and over 6,000 mammals. These figures – particularly for lesser-known groups such as plants or fungi – might be a bit too high. This is because some described species are synonyms – the description of already-known species, simply given a separate name.{ref}Costello, M. J., May, R. M., & Stork, N. E. (2013). Can we name Earth's species before they go extinct?. Science, 339(6118), 413-416.{/ref} There is a continual evaluation process to remove synonyms (and most are removed eventually), but often species are added at a faster rate than synonyms can be found and removed.{ref}Solow, A. R., Mound, L. A., & Gaston, K. J. (1995). Estimating the rate of synonymy. Systematic Biology, 44(1), 93-96.{/ref} To give a sense of how large this effect might be, in a study published in Science, Costello et al. (2013) estimated that around 20% of the described species were undiscovered synonyms (in other… | {"id": 54648, "date": "2022-11-30T11:42:49", "guid": {"rendered": "https://owid.cloud/?p=54648"}, "link": "https://owid.cloud/how-many-species-are-there", "meta": {"owid_publication_context_meta_field": []}, "slug": "how-many-species-are-there", "tags": [], "type": "post", "title": {"rendered": "How many species are there?"}, "_links": {"self": [{"href": "https://owid.cloud/wp-json/wp/v2/posts/54648"}], "about": [{"href": "https://owid.cloud/wp-json/wp/v2/types/post"}], "author": [{"href": "https://owid.cloud/wp-json/wp/v2/users/17", "embeddable": true}], "curies": [{"href": "https://api.w.org/{rel}", "name": "wp", "templated": true}], "replies": [{"href": "https://owid.cloud/wp-json/wp/v2/comments?post=54648", "embeddable": true}], "wp:term": [{"href": "https://owid.cloud/wp-json/wp/v2/categories?post=54648", "taxonomy": "category", "embeddable": true}, {"href": "https://owid.cloud/wp-json/wp/v2/tags?post=54648", "taxonomy": "post_tag", "embeddable": true}], "collection": [{"href": "https://owid.cloud/wp-json/wp/v2/posts"}], "wp:attachment": [{"href": "https://owid.cloud/wp-json/wp/v2/media?parent=54648"}], "version-history": [{"href": "https://owid.cloud/wp-json/wp/v2/posts/54648/revisions", "count": 6}], "wp:featuredmedia": [{"href": "https://owid.cloud/wp-json/wp/v2/media/54664", "embeddable": true}], "predecessor-version": [{"id": 58668, "href": "https://owid.cloud/wp-json/wp/v2/posts/54648/revisions/58668"}]}, "author": 17, "format": "standard", "status": "publish", "sticky": false, "content": {"rendered": "\n<p>How many species do we share our planet with? It’s such a basic and fundamental question to understanding the world around us. </p>\n\n\n\n<p>It’s almost unthinkable that we would not know this number or at least have a good estimate. But the truth is that it’s a question that continues to escape the world’s taxonomists.</p>\n\n\n\n<p>An important distinction is <strong>how many species we have identified and described</strong> and how many species there actually are. We̵… |
| 1157 | 1157 | 54645 | Did humans cause the Quaternary megafauna extinction? | quaternary-megafauna-extinction | post | publish | <!-- wp-block-tombstone 42388 -->
<!-- wp:columns -->
<div class="wp-block-columns"><!-- wp:column -->
<div class="wp-block-column"><!-- wp:paragraph -->
<p>Humans have had such a profound impact on the planet’s ecosystems and climate that Earth might be defined by a new geological epoch: the Anthropocene (where “anthropo” means “human”). </p>
<!-- /wp:paragraph -->
<!-- wp:paragraph -->
<p>Some think this new epoch should start during the Industrial Revolution, and some at the advent of agriculture 10,000 to 15,000 years ago. This feeds into the popular notion that environmental destruction is a recent phenomenon.</p>
<!-- /wp:paragraph -->
<!-- wp:paragraph -->
<p>The lives of our ancestors are often romanticized. Many think they lived in balance with nature, unlike modern society where we fight against it. But when we look at the evidence of human impacts over millennia, it's hard to see how this was true.</p>
<!-- /wp:paragraph -->
<!-- wp:paragraph -->
<p>Our ancient ancestors contributed to the extinction of many of the world's largest mammals ('megafauna'). This was during an event known as the Quaternary megafauna extinction (QME).</p>
<!-- /wp:paragraph -->
<!-- wp:paragraph -->
<p>The extent of these extinctions across continents is shown in the chart. Between 52,000 and 9,000 BCE, more than 178 species of the world’s largest mammals were killed off. These were mammals heavier than 44 kilograms, ranging from mammals the size of sheep to mammoths.</p>
<!-- /wp:paragraph -->
<!-- wp:paragraph -->
<p>There is strong evidence to suggest that these were largely driven by humans – we look at this in more detail later.</p>
<!-- /wp:paragraph -->
<!-- wp:paragraph -->
<p>Africa was the least hard-hit, losing only 21% of its megafauna. Humans evolved in Africa, and hominins had already interacted with mammals for a long time. The same is also likely to be true across Eurasia, where 35% of megafauna were lost. But Australia, North America, and South America were particularly hard-hit; very soon after humans… |
{"id": "wp-54645", "slug": "quaternary-megafauna-extinction", "content": {"toc": [], "body": [{"left": [{"type": "text", "value": [{"text": "Humans have had such a profound impact on the planet’s ecosystems and climate that Earth might be defined by a new geological epoch: the Anthropocene (where “anthropo” means “human”). ", "spanType": "span-simple-text"}], "parseErrors": []}, {"type": "text", "value": [{"text": "Some think this new epoch should start during the Industrial Revolution, and some at the advent of agriculture 10,000 to 15,000 years ago. This feeds into the popular notion that environmental destruction is a recent phenomenon.", "spanType": "span-simple-text"}], "parseErrors": []}, {"type": "text", "value": [{"text": "The lives of our ancestors are often romanticized. Many think they lived in balance with nature, unlike modern society where we fight against it. But when we look at the evidence of human impacts over millennia, it's hard to see how this was true.", "spanType": "span-simple-text"}], "parseErrors": []}, {"type": "text", "value": [{"text": "Our ancient ancestors contributed to the extinction of many of the world's largest mammals ('megafauna'). This was during an event known as the Quaternary megafauna extinction (QME).", "spanType": "span-simple-text"}], "parseErrors": []}, {"type": "text", "value": [{"text": "The extent of these extinctions across continents is shown in the chart. Between 52,000 and 9,000 BCE, more than 178 species of the world’s largest mammals were killed off. These were mammals heavier than 44 kilograms, ranging from mammals the size of sheep to mammoths.", "spanType": "span-simple-text"}], "parseErrors": []}, {"type": "text", "value": [{"text": "There is strong evidence to suggest that these were largely driven by humans – we look at this in more detail later.", "spanType": "span-simple-text"}], "parseErrors": []}, {"type": "text", "value": [{"text": "Africa was the least hard-hit, losing only 21% of its megafauna. Humans evolved in Africa, and hominins had already … | {"errors": [{"name": "unexpected wp component tag", "details": "Found unhandled wp:comment tag image"}, {"name": "unexpected wp component tag", "details": "Found unhandled wp:comment tag image"}], "numBlocks": 14, "numErrors": 2, "wpTagCounts": {"image": 2, "column": 4, "columns": 2, "heading": 1, "paragraph": 20}, "htmlTagCounts": {"p": 20, "h3": 1, "div": 6, "figure": 2}} | 2022-11-30 11:37:17 | 2024-03-09 18:05:37 | 1xvpuhv6qiU_cIKj8RfBPuW_t6sBwTruu7PQWWfHHRCs | ["Hannah Ritchie"] | 10,000 to 50,000 years ago, hundreds of the largest mammals went extinct. It's likely that humans were the key driver of this. | 2022-11-30 11:37:17 | 2024-01-11 10:43:08 | https://ourworldindata.org/wp-content/uploads/2022/11/Quaternary-extinctions-featured-image.png | {} | Humans have had such a profound impact on the planet’s ecosystems and climate that Earth might be defined by a new geological epoch: the Anthropocene (where “anthropo” means “human”). Some think this new epoch should start during the Industrial Revolution, and some at the advent of agriculture 10,000 to 15,000 years ago. This feeds into the popular notion that environmental destruction is a recent phenomenon. The lives of our ancestors are often romanticized. Many think they lived in balance with nature, unlike modern society where we fight against it. But when we look at the evidence of human impacts over millennia, it's hard to see how this was true. Our ancient ancestors contributed to the extinction of many of the world's largest mammals ('megafauna'). This was during an event known as the Quaternary megafauna extinction (QME). The extent of these extinctions across continents is shown in the chart. Between 52,000 and 9,000 BCE, more than 178 species of the world’s largest mammals were killed off. These were mammals heavier than 44 kilograms, ranging from mammals the size of sheep to mammoths. There is strong evidence to suggest that these were largely driven by humans – we look at this in more detail later. Africa was the least hard-hit, losing only 21% of its megafauna. Humans evolved in Africa, and hominins had already interacted with mammals for a long time. The same is also likely to be true across Eurasia, where 35% of megafauna were lost. But Australia, North America, and South America were particularly hard-hit; very soon after humans arrived, most large mammals were gone. Australia lost 88%; North America lost 83%; and South America, 72%. Far from being in balance with ecosystems, tiny populations of hunter-gatherers changed them forever. By 8,000 BCE – almost at the end of the QME – there were only around [5 million people](https://ourworldindata.org/grapher/world-population-1750-2015-and-un-projection-until-2100) in the world. <Image filename="QME-Extinctions.png" alt=""/> ## Did humans … | {"id": 54645, "date": "2022-11-30T11:37:17", "guid": {"rendered": "https://owid.cloud/?p=54645"}, "link": "https://owid.cloud/quaternary-megafauna-extinction", "meta": {"owid_publication_context_meta_field": []}, "slug": "quaternary-megafauna-extinction", "tags": [], "type": "post", "title": {"rendered": "Did humans cause the Quaternary megafauna extinction?"}, "_links": {"self": [{"href": "https://owid.cloud/wp-json/wp/v2/posts/54645"}], "about": [{"href": "https://owid.cloud/wp-json/wp/v2/types/post"}], "author": [{"href": "https://owid.cloud/wp-json/wp/v2/users/17", "embeddable": true}], "curies": [{"href": "https://api.w.org/{rel}", "name": "wp", "templated": true}], "replies": [{"href": "https://owid.cloud/wp-json/wp/v2/comments?post=54645", "embeddable": true}], "wp:term": [{"href": "https://owid.cloud/wp-json/wp/v2/categories?post=54645", "taxonomy": "category", "embeddable": true}, {"href": "https://owid.cloud/wp-json/wp/v2/tags?post=54645", "taxonomy": "post_tag", "embeddable": true}], "collection": [{"href": "https://owid.cloud/wp-json/wp/v2/posts"}], "wp:attachment": [{"href": "https://owid.cloud/wp-json/wp/v2/media?parent=54645"}], "version-history": [{"href": "https://owid.cloud/wp-json/wp/v2/posts/54645/revisions", "count": 2}], "wp:featuredmedia": [{"href": "https://owid.cloud/wp-json/wp/v2/media/54661", "embeddable": true}], "predecessor-version": [{"id": 58612, "href": "https://owid.cloud/wp-json/wp/v2/posts/54645/revisions/58612"}]}, "author": 17, "format": "standard", "status": "publish", "sticky": false, "content": {"rendered": "\n<div class=\"wp-block-columns\">\n<div class=\"wp-block-column\">\n<p>Humans have had such a profound impact on the planet’s ecosystems and climate that Earth might be defined by a new geological epoch: the Anthropocene (where “anthropo” means “human”). </p>\n\n\n\n<p>Some think this new epoch should start during the Industrial Revolution, and some at the advent of agriculture 10,000 to 15,000 years ago. This feeds into the popular notion that environmental destructi… |
| 1156 | 1156 | 54640 | Global whaling peaked in the 1960s | whaling | post | publish | <!-- wp-block-tombstone 41945 -->
<!-- wp:paragraph -->
<p>Weighing in at over 150 tonnes, Blue Whales are the <a href="https://en.wikipedia.org/wiki/Blue_whale">largest animal</a> to have lived on Earth. But their size hasn’t protected them from human exploitation. In fact, their size made them an incredibly valuable source of oil, meat and blubber. This fat gave us a rich fuel for energy and many other industrial uses.</p>
<!-- /wp:paragraph -->
<!-- wp:paragraph -->
<p>Human hunting has resulted in a massive decline in global whale populations. Some have been pushed to the brink of extinction. But, as we will see, a combination of technological change, economic incentives and international policies have brought global whaling to very low levels. While some populations are still very small, we have been successful in preserving these beautiful animals.</p>
<!-- /wp:paragraph -->
<!-- wp:heading {"level":4} -->
<h4>Early whaling in the United States</h4>
<!-- /wp:heading -->
<!-- wp:columns -->
<div class="wp-block-columns"><!-- wp:column -->
<div class="wp-block-column"><!-- wp:paragraph -->
<p>Whaling is a practice that dates back to Medieval times; fortunately at low levels, meaning this early practice had little impact on whale populations.{ref}Birnie, P. W. (1989). <a href="https://www.jstor.org/stable/24883418">International legal issues in the management and protection of the whale: a review of four decades of experience</a>. <em>Natural Resources Journal</em>, <em>29</em>(4), 903-934.{/ref}</p>
<!-- /wp:paragraph -->
<!-- wp:paragraph -->
<p>While global whaling was a feature of the 1900s, the peak of whaling in the United States was a century earlier. In the 18th and 19th centuries, whaling was a key industry in the US. </p>
<!-- /wp:paragraph -->
<!-- wp:paragraph -->
<p>Although the uses of whale oil later diversified, Americans mainly used it for lighting. Whale oil was used for the lighting of not only homes but also outdoor street lighting, lighthouses and miner’s headlamps – a range of uses t… |
{"id": "wp-54640", "slug": "whaling", "content": {"toc": [], "body": [{"type": "text", "value": [{"text": "Weighing in at over 150 tonnes, Blue Whales are the ", "spanType": "span-simple-text"}, {"url": "https://en.wikipedia.org/wiki/Blue_whale", "children": [{"text": "largest animal", "spanType": "span-simple-text"}], "spanType": "span-link"}, {"text": " to have lived on Earth. But their size hasn’t protected them from human exploitation. In fact, their size made them an incredibly valuable source of oil, meat and blubber. This fat gave us a rich fuel for energy and many other industrial uses.", "spanType": "span-simple-text"}], "parseErrors": []}, {"type": "text", "value": [{"text": "Human hunting has resulted in a massive decline in global whale populations. Some have been pushed to the brink of extinction. But, as we will see, a combination of technological change, economic incentives and international policies have brought global whaling to very low levels. While some populations are still very small, we have been successful in preserving these beautiful animals.", "spanType": "span-simple-text"}], "parseErrors": []}, {"text": [{"text": "Early whaling in the United States", "spanType": "span-simple-text"}], "type": "heading", "level": 2, "parseErrors": []}, {"left": [{"type": "text", "value": [{"text": "Whaling is a practice that dates back to Medieval times; fortunately at low levels, meaning this early practice had little impact on whale populations.{ref}Birnie, P. W. (1989). ", "spanType": "span-simple-text"}, {"url": "https://www.jstor.org/stable/24883418", "children": [{"text": "International legal issues in the management and protection of the whale: a review of four decades of experience", "spanType": "span-simple-text"}], "spanType": "span-link"}, {"text": ". ", "spanType": "span-simple-text"}, {"children": [{"text": "Natural Resources Journal", "spanType": "span-simple-text"}], "spanType": "span-italic"}, {"text": ", ", "spanType": "span-simple-text"}, {"children": [{"text": "29", "spanType": "span-… | {"errors": [{"name": "unexpected wp component tag", "details": "Found unhandled wp:comment tag image"}], "numBlocks": 10, "numErrors": 1, "wpTagCounts": {"html": 4, "image": 1, "column": 10, "columns": 5, "heading": 5, "paragraph": 31, "owid/prominent-link": 1}, "htmlTagCounts": {"p": 31, "h4": 4, "h5": 1, "div": 15, "figure": 1, "iframe": 4}} | 2022-11-30 11:22:02 | 2024-03-09 17:48:55 | 1WbJhtdgw15UFDWiFiV1RtjOVC6yGgA-OHG5ODZTgMDA | ["Hannah Ritchie"] | Intense whaling drove many of the world’s whale species close to extinction. But a dramatic decline in whale hunting since then has given them hopes of recovery. | 2022-11-30 11:22:02 | 2022-12-01 12:02:01 | https://ourworldindata.org/wp-content/uploads/2022/11/Whaling-featured-image.png | {} | Weighing in at over 150 tonnes, Blue Whales are the [largest animal](https://en.wikipedia.org/wiki/Blue_whale) to have lived on Earth. But their size hasn’t protected them from human exploitation. In fact, their size made them an incredibly valuable source of oil, meat and blubber. This fat gave us a rich fuel for energy and many other industrial uses. Human hunting has resulted in a massive decline in global whale populations. Some have been pushed to the brink of extinction. But, as we will see, a combination of technological change, economic incentives and international policies have brought global whaling to very low levels. While some populations are still very small, we have been successful in preserving these beautiful animals. ## Early whaling in the United States Whaling is a practice that dates back to Medieval times; fortunately at low levels, meaning this early practice had little impact on whale populations.{ref}Birnie, P. W. (1989). [International legal issues in the management and protection of the whale: a review of four decades of experience](https://www.jstor.org/stable/24883418). _Natural Resources Journal_, _29_(4), 903-934.{/ref} While global whaling was a feature of the 1900s, the peak of whaling in the United States was a century earlier. In the 18th and 19th centuries, whaling was a key industry in the US. Although the uses of whale oil later diversified, Americans mainly used it for lighting. Whale oil was used for the lighting of not only homes but also outdoor street lighting, lighthouses and miner’s headlamps – a range of uses that had a big impact on civilization during that period.{ref}Starbuck, A., 1878, (reprinted 1989), History of the American whale fishery: Secaucus, NJ., Castle.{/ref} As we see in the chart, US production of whale and sperm oil followed the classic inverted-U curve, peaking in the mid-19th century. At this point, petroleum oil had been discovered, and kerosene – which was cheaper than whale oil – began to replace it in lighting. As whale hunting became in… | {"id": 54640, "date": "2022-11-30T11:22:02", "guid": {"rendered": "https://owid.cloud/?p=54640"}, "link": "https://owid.cloud/whaling", "meta": {"owid_publication_context_meta_field": []}, "slug": "whaling", "tags": [], "type": "post", "title": {"rendered": "Global whaling peaked in the 1960s"}, "_links": {"self": [{"href": "https://owid.cloud/wp-json/wp/v2/posts/54640"}], "about": [{"href": "https://owid.cloud/wp-json/wp/v2/types/post"}], "author": [{"href": "https://owid.cloud/wp-json/wp/v2/users/17", "embeddable": true}], "curies": [{"href": "https://api.w.org/{rel}", "name": "wp", "templated": true}], "replies": [{"href": "https://owid.cloud/wp-json/wp/v2/comments?post=54640", "embeddable": true}], "wp:term": [{"href": "https://owid.cloud/wp-json/wp/v2/categories?post=54640", "taxonomy": "category", "embeddable": true}, {"href": "https://owid.cloud/wp-json/wp/v2/tags?post=54640", "taxonomy": "post_tag", "embeddable": true}], "collection": [{"href": "https://owid.cloud/wp-json/wp/v2/posts"}], "wp:attachment": [{"href": "https://owid.cloud/wp-json/wp/v2/media?parent=54640"}], "version-history": [{"href": "https://owid.cloud/wp-json/wp/v2/posts/54640/revisions", "count": 2}], "wp:featuredmedia": [{"href": "https://owid.cloud/wp-json/wp/v2/media/54662", "embeddable": true}], "predecessor-version": [{"id": 54644, "href": "https://owid.cloud/wp-json/wp/v2/posts/54640/revisions/54644"}]}, "author": 17, "format": "standard", "status": "publish", "sticky": false, "content": {"rendered": "\n<p>Weighing in at over 150 tonnes, Blue Whales are the <a href=\"https://en.wikipedia.org/wiki/Blue_whale\">largest animal</a> to have lived on Earth. But their size hasn’t protected them from human exploitation. In fact, their size made them an incredibly valuable source of oil, meat and blubber. This fat gave us a rich fuel for energy and many other industrial uses.</p>\n\n\n\n<p>Human hunting has resulted in a massive decline in global whale populations. Some have been pushed to the brink of extinction. But, as we will see, a com… |
| 1155 | 1155 | 54629 | The state of the world's rhino populations | rhino-populations | post | publish | <!-- wp-block-tombstone 41937 -->
<!-- wp:paragraph -->
<p>The largest mammals are at the greatest risk of extinction. This has been the case since the arrival of humans, and is still true today.</p>
<!-- /wp:paragraph -->
<!-- wp:paragraph -->
<p>Weighing in at several tonnes, rhinos are some of the world’s largest mammals.{ref}The <a rel="noreferrer noopener" href="https://web.archive.org/web/20230130123018/https://rhinos.org/wp-content/uploads/2020/10/IRF_factsheet_digital_Mar2020-1.pdf" target="_blank">average mass of rhinos</a> vary by species and sex. Male White and Indian rhinos can weigh up to 2700 kilograms; at the other end, Sumatran rhinos have a lower range of around 600 kilograms.{/ref} With extravagant prices for rhino horns and body parts, they’re also one of the most threatened: three of the five rhino species are ‘critically endangered’. </p>
<!-- /wp:paragraph -->
<!-- wp:paragraph -->
<p>In this article we take a look at the status of rhino populations today, and whether they are in decline or on the path to recovery. They offer us both stories of concern and reasons for optimism.</p>
<!-- /wp:paragraph -->
<!-- wp:heading {"level":3} -->
<h3>State of rhino populations today</h3>
<!-- /wp:heading -->
<!-- wp:paragraph -->
<p>There are five species of rhino. Africa is home to the White and Black Rhino. The remaining three – the Sumatran, Javan and Indian – exist in Asia. </p>
<!-- /wp:paragraph -->
<!-- wp:paragraph -->
<p>Some of these species have dangerously low population levels.</p>
<!-- /wp:paragraph -->
<!-- wp:paragraph -->
<p>The Sumatran and the Javan Rhino can now only be found in Indonesia. They are Critically Endangered with less than 100 individuals left in the wild. The Black Rhino, despite having a population in the thousands, is also Critically Endangered. It experienced a rapid decline over the 20th century as we will see later.</p>
<!-- /wp:paragraph -->
<!-- wp:paragraph -->
<p>The Indian (Greater One-Horned) offers us an important success story; it has seen a sig… |
{"id": "wp-54629", "slug": "rhino-populations", "content": {"toc": [], "body": [{"type": "text", "value": [{"text": "The largest mammals are at the greatest risk of extinction. This has been the case since the arrival of humans, and is still true today.", "spanType": "span-simple-text"}], "parseErrors": []}, {"type": "text", "value": [{"text": "Weighing in at several tonnes, rhinos are some of the world’s largest mammals.{ref}The ", "spanType": "span-simple-text"}, {"url": "https://web.archive.org/web/20230130123018/https://rhinos.org/wp-content/uploads/2020/10/IRF_factsheet_digital_Mar2020-1.pdf", "children": [{"text": "average mass of rhinos", "spanType": "span-simple-text"}], "spanType": "span-link"}, {"text": " vary by species and sex. Male White and Indian rhinos can weigh up to 2700 kilograms; at the other end, Sumatran rhinos have a lower range of around 600 kilograms.{/ref} With extravagant prices for rhino horns and body parts, they’re also one of the most threatened: three of the five rhino species are ‘critically endangered’. ", "spanType": "span-simple-text"}], "parseErrors": []}, {"type": "text", "value": [{"text": "In this article we take a look at the status of rhino populations today, and whether they are in decline or on the path to recovery. They offer us both stories of concern and reasons for optimism.", "spanType": "span-simple-text"}], "parseErrors": []}, {"text": [{"text": "State of rhino populations today", "spanType": "span-simple-text"}], "type": "heading", "level": 2, "parseErrors": []}, {"type": "text", "value": [{"text": "There are five species of rhino. Africa is home to the White and Black Rhino. The remaining three – the Sumatran, Javan and Indian – exist in Asia. ", "spanType": "span-simple-text"}], "parseErrors": []}, {"type": "text", "value": [{"text": "Some of these species have dangerously low population levels.", "spanType": "span-simple-text"}], "parseErrors": []}, {"type": "text", "value": [{"text": "The Sumatran and the Javan Rhino can now only be found in Indonesia. They … | {"errors": [], "numBlocks": 53, "numErrors": 0, "wpTagCounts": {"html": 12, "column": 14, "columns": 7, "heading": 8, "paragraph": 39}, "htmlTagCounts": {"p": 39, "h3": 2, "h4": 6, "div": 21, "iframe": 12}} | 2022-11-30 10:38:19 | 2024-03-06 14:59:49 | 1G89eli-ne-k-GFvfTQ0F5kHWtyx-90oCrTjwqJ8cNXQ | ["Hannah Ritchie"] | How have rhino populations changed over time? What species are at risk of extinction today? | 2022-11-30 10:37:36 | 2023-01-30 12:36:59 | https://ourworldindata.org/wp-content/uploads/2022/11/Rhino-thumbnail.png | {} | The largest mammals are at the greatest risk of extinction. This has been the case since the arrival of humans, and is still true today. Weighing in at several tonnes, rhinos are some of the world’s largest mammals.{ref}The [average mass of rhinos](https://web.archive.org/web/20230130123018/https://rhinos.org/wp-content/uploads/2020/10/IRF_factsheet_digital_Mar2020-1.pdf) vary by species and sex. Male White and Indian rhinos can weigh up to 2700 kilograms; at the other end, Sumatran rhinos have a lower range of around 600 kilograms.{/ref} With extravagant prices for rhino horns and body parts, they’re also one of the most threatened: three of the five rhino species are ‘critically endangered’. In this article we take a look at the status of rhino populations today, and whether they are in decline or on the path to recovery. They offer us both stories of concern and reasons for optimism. ## State of rhino populations today There are five species of rhino. Africa is home to the White and Black Rhino. The remaining three – the Sumatran, Javan and Indian – exist in Asia. Some of these species have dangerously low population levels. The Sumatran and the Javan Rhino can now only be found in Indonesia. They are Critically Endangered with less than 100 individuals left in the wild. The Black Rhino, despite having a population in the thousands, is also Critically Endangered. It experienced a rapid decline over the 20th century as we will see later. The Indian (Greater One-Horned) offers us an important success story; it has seen a significant recovery in recent decades. The White Rhino too has shown an impressive recovery. But it has a dark side: the _Southern_ White Rhino might be doing well but the _Northern_ sub-species is on the brink of extinction. There are only two Northern White Rhinos left, and both of them are female. ## Are rhino populations increasing or decreasing? The health of these rhino populations is not just determined by how many animals are left today. The direction and pace that these popu… | {"id": 54629, "date": "2022-11-30T10:38:19", "guid": {"rendered": "https://owid.cloud/?p=54629"}, "link": "https://owid.cloud/rhino-populations", "meta": {"owid_publication_context_meta_field": []}, "slug": "rhino-populations", "tags": [], "type": "post", "title": {"rendered": "The state of the world’s rhino populations"}, "_links": {"self": [{"href": "https://owid.cloud/wp-json/wp/v2/posts/54629"}], "about": [{"href": "https://owid.cloud/wp-json/wp/v2/types/post"}], "author": [{"href": "https://owid.cloud/wp-json/wp/v2/users/17", "embeddable": true}], "curies": [{"href": "https://api.w.org/{rel}", "name": "wp", "templated": true}], "replies": [{"href": "https://owid.cloud/wp-json/wp/v2/comments?post=54629", "embeddable": true}], "wp:term": [{"href": "https://owid.cloud/wp-json/wp/v2/categories?post=54629", "taxonomy": "category", "embeddable": true}, {"href": "https://owid.cloud/wp-json/wp/v2/tags?post=54629", "taxonomy": "post_tag", "embeddable": true}], "collection": [{"href": "https://owid.cloud/wp-json/wp/v2/posts"}], "wp:attachment": [{"href": "https://owid.cloud/wp-json/wp/v2/media?parent=54629"}], "version-history": [{"href": "https://owid.cloud/wp-json/wp/v2/posts/54629/revisions", "count": 2}], "wp:featuredmedia": [{"href": "https://owid.cloud/wp-json/wp/v2/media/54669", "embeddable": true}], "predecessor-version": [{"id": 54634, "href": "https://owid.cloud/wp-json/wp/v2/posts/54629/revisions/54634"}]}, "author": 17, "format": "standard", "status": "publish", "sticky": false, "content": {"rendered": "\n<p>The largest mammals are at the greatest risk of extinction. This has been the case since the arrival of humans, and is still true today.</p>\n\n\n\n<p>Weighing in at several tonnes, rhinos are some of the world’s largest mammals.{ref}The <a rel=\"noreferrer noopener\" href=\"https://web.archive.org/web/20230130123018/https://rhinos.org/wp-content/uploads/2020/10/IRF_factsheet_digital_Mar2020-1.pdf\" target=\"_blank\">average mass of rhinos</a> vary by species and sex. Male White and Indian rhinos… |
| 1154 | 1154 | 54596 | We just published a new topic page on Artificial Intelligence | artificial-intelligence-launch | post | publish | {"id": "wp-54596", "slug": "artificial-intelligence-launch", "content": {"toc": [], "body": [], "type": "article", "title": "We just published a new topic page on Artificial Intelligence", "authors": ["Charlie Giattino", "Edouard Mathieu", "Julia Broden", "Max Roser"], "excerpt": "AI is already having a large impact on our world. Explore research and data to understand the trajectory of this important technology.", "dateline": "December 6, 2022", "subtitle": "AI is already having a large impact on our world. Explore research and data to understand the trajectory of this important technology.", "sidebar-toc": false, "featured-image": "artificial-intelligence-featured-image.png"}, "createdAt": "2022-11-28T11:25:03.000Z", "published": false, "updatedAt": "2022-12-06T11:34:03.000Z", "revisionId": null, "publishedAt": "2022-12-06T00:00:00.000Z", "relatedCharts": [], "publicationContext": "listed"} | {"errors": [], "numBlocks": 0, "numErrors": 0, "wpTagCounts": {}, "htmlTagCounts": {}} | 2022-12-06 00:00:00 | 2024-02-16 14:22:54 | ["Charlie Giattino", "Edouard Mathieu", "Julia Broden", "Max Roser"] | AI is already having a large impact on our world. Explore research and data to understand the trajectory of this important technology. | 2022-11-28 11:25:03 | 2022-12-06 11:34:03 | https://ourworldindata.org/wp-content/uploads/2022/11/artificial-intelligence-featured-image.png | {} | {"id": 54596, "date": "2022-12-06T00:00:00", "guid": {"rendered": "https://owid.cloud/?p=54596"}, "link": "https://owid.cloud/artificial-intelligence-launch", "meta": {"owid_publication_context_meta_field": {"latest": true, "homepage": true, "immediate_newsletter": true}}, "slug": "artificial-intelligence-launch", "tags": [], "type": "post", "title": {"rendered": "We just published a new topic page on Artificial Intelligence"}, "_links": {"self": [{"href": "https://owid.cloud/wp-json/wp/v2/posts/54596"}], "about": [{"href": "https://owid.cloud/wp-json/wp/v2/types/post"}], "author": [{"href": "https://owid.cloud/wp-json/wp/v2/users/44", "embeddable": true}], "curies": [{"href": "https://api.w.org/{rel}", "name": "wp", "templated": true}], "replies": [{"href": "https://owid.cloud/wp-json/wp/v2/comments?post=54596", "embeddable": true}], "wp:term": [{"href": "https://owid.cloud/wp-json/wp/v2/categories?post=54596", "taxonomy": "category", "embeddable": true}, {"href": "https://owid.cloud/wp-json/wp/v2/tags?post=54596", "taxonomy": "post_tag", "embeddable": true}], "collection": [{"href": "https://owid.cloud/wp-json/wp/v2/posts"}], "wp:attachment": [{"href": "https://owid.cloud/wp-json/wp/v2/media?parent=54596"}], "version-history": [{"href": "https://owid.cloud/wp-json/wp/v2/posts/54596/revisions", "count": 4}], "wp:featuredmedia": [{"href": "https://owid.cloud/wp-json/wp/v2/media/54594", "embeddable": true}], "predecessor-version": [{"id": 54725, "href": "https://owid.cloud/wp-json/wp/v2/posts/54596/revisions/54725"}]}, "author": 44, "format": "standard", "status": "publish", "sticky": false, "content": {"rendered": "", "protected": false}, "excerpt": {"rendered": "AI is already having a large impact on our world. Explore research and data to understand the trajectory of this important technology.", "protected": false}, "date_gmt": "2022-12-06T00:00:00", "modified": "2022-12-06T11:34:03", "template": "", "categories": [1], "ping_status": "closed", "authors_name": ["Charlie Giattino", "Edouard Mathieu", "Julia Brode… | |||
| 1153 | 1153 | 54575 | Artificial Intelligence | artificial-intelligence | page | publish | <!-- wp:html -->
<!-- formatting-options toc:false bodyClassName:topic-page -->
<!-- /wp:html -->
<!-- wp:owid/sticky-nav -->
<!-- wp:navigation-link {"label":"Introduction","url":"#introduction","kind":"custom","isTopLevelLink":false} /-->
<!-- wp:navigation-link {"label":"Research and Writing","url":"#research-and-writing","kind":"custom","isTopLevelLink":false} /-->
<!-- wp:navigation-link {"label":"Charts","type":"internal","url":"#interactive-charts-on-artificial-intelligence","kind":"custom","isTopLevelLink":false} /-->
<!-- wp:navigation-link {"label":"Endnotes","url":"#endnotes","kind":"custom","isTopLevelLink":false} /-->
<!-- wp:navigation-link {"label":"Cite This Work","url":"#citation","kind":"custom","isTopLevelLink":false} /-->
<!-- wp:navigation-link {"label":"Reuse This Work","url":"#licence","kind":"custom","isTopLevelLink":false} /-->
<!-- /wp:owid/sticky-nav -->
<!-- wp:columns {"className":"front-matter"} -->
<div class="wp-block-columns front-matter"><!-- wp:column -->
<div class="wp-block-column" id="introduction"><!-- wp:paragraph -->
<p>Artificial intelligence (AI) systems already greatly impact our lives — they increasingly shape what we see, believe, and do. Based on the steady advances in AI technology and the large recent <a href="/ai-investments">increases</a> in investment, we should expect AI technology to become even more powerful and impactful in the following years and decades. </p>
<!-- /wp:paragraph -->
<!-- wp:paragraph -->
<p>It is <a href="/technology-long-run">easy to underestimate</a> how much the world can change within a lifetime, so it is worth taking seriously what those who work on AI expect for the future. Many AI experts <a href="/ai-timelines">believe</a> there is a real chance that human-level artificial intelligence will be developed within the following decades, and some think it will exist much sooner. </p>
<!-- /wp:paragraph -->
<!-- wp:paragraph -->
<p>How such powerful AI systems are built and used will be very important for the future of our world … |
{"id": "wp-54575", "slug": "artificial-intelligence", "content": {"toc": [], "body": [{"left": [{"type": "text", "value": [{"text": "Artificial intelligence (AI) systems already greatly impact our lives — they increasingly shape what we see, believe, and do. Based on the steady advances in AI technology and the large recent ", "spanType": "span-simple-text"}, {"url": "/ai-investments", "children": [{"text": "increases", "spanType": "span-simple-text"}], "spanType": "span-link"}, {"text": " in investment, we should expect AI technology to become even more powerful and impactful in the following years and decades. ", "spanType": "span-simple-text"}], "parseErrors": []}, {"type": "text", "value": [{"text": "It is ", "spanType": "span-simple-text"}, {"url": "/technology-long-run", "children": [{"text": "easy to underestimate", "spanType": "span-simple-text"}], "spanType": "span-link"}, {"text": " how much the world can change within a lifetime, so it is worth taking seriously what those who work on AI expect for the future. Many AI experts ", "spanType": "span-simple-text"}, {"url": "/ai-timelines", "children": [{"text": "believe", "spanType": "span-simple-text"}], "spanType": "span-link"}, {"text": " there is a real chance that human-level artificial intelligence will be developed within the following decades, and some think it will exist much sooner. ", "spanType": "span-simple-text"}], "parseErrors": []}, {"type": "text", "value": [{"text": "How such powerful AI systems are built and used will be very important for the future of our world and our own lives. All technologies have positive and negative consequences, but with AI, the range of these consequences is extraordinarily large: the technology has immense potential for good. Still, it comes with significant downsides and high risks. ", "spanType": "span-simple-text"}], "parseErrors": []}, {"type": "text", "value": [{"text": "A technology that has such an enormous impact needs to be of central interest to people across our ", "spanType": "span-simple-text"}, {… | {"errors": [{"name": "unexpected wp component tag", "details": "Found unhandled wp:comment tag navigation-link"}, {"name": "unexpected wp component tag", "details": "Found unhandled wp:comment tag navigation-link"}, {"name": "unexpected wp component tag", "details": "Found unhandled wp:comment tag navigation-link"}, {"name": "unexpected wp component tag", "details": "Found unhandled wp:comment tag navigation-link"}, {"name": "unexpected wp component tag", "details": "Found unhandled wp:comment tag navigation-link"}, {"name": "unexpected wp component tag", "details": "Found unhandled wp:comment tag navigation-link"}, {"name": "unexpected wp component tag", "details": "Found unhandled wp:comment tag owid/sticky-nav"}, {"name": "unexpected wp component tag", "details": "Found unhandled wp:comment tag button"}, {"name": "unexpected wp component tag", "details": "Found unhandled wp:comment tag list"}, {"name": "unexpected wp component tag", "details": "Found unhandled wp:comment tag group"}, {"name": "unexpected wp component tag", "details": "Found unhandled wp:comment tag owid/card"}, {"name": "unexpected wp component tag", "details": "Found unhandled wp:comment tag owid/card"}, {"name": "unexpected wp component tag", "details": "Found unhandled wp:comment tag group"}, {"name": "unexpected wp component tag", "details": "Found unhandled wp:comment tag group"}, {"name": "unexpected wp component tag", "details": "Found unhandled wp:comment tag group"}, {"name": "unexpected wp component tag", "details": "Found unhandled wp:comment tag group"}, {"name": "unexpected wp component tag", "details": "Found unhandled wp:comment tag group"}, {"name": "unexpected wp component tag", "details": "Found unhandled wp:comment tag group"}, {"name": "unexpected wp component tag", "details": "Found unhandled wp:comment tag group"}, {"name": "unexpected wp component tag", "details": "Found unhandled wp:comment tag group"}, {"name": "unexpected wp component tag", "details": "Found unhandled wp:comment tag owid/research-and-writing"}, {"name… | 2022-12-06 07:51:00 | 2024-03-05 09:19:03 | ["Charlie Giattino", "Edouard Mathieu", "Veronika Samborska", "Julia Broden", "Max Roser"] | AI is already having a large impact on our world. Explore research and data to understand the trajectory of this important technology. | 2022-11-28 11:07:02 | 2023-06-21 13:08:47 | https://ourworldindata.org/wp-content/uploads/2022/11/artificial-intelligence-featured-image.png | {"toc": false, "bodyClassName": "topic-page"} | Artificial intelligence (AI) systems already greatly impact our lives — they increasingly shape what we see, believe, and do. Based on the steady advances in AI technology and the large recent [increases](/ai-investments) in investment, we should expect AI technology to become even more powerful and impactful in the following years and decades. It is [easy to underestimate](/technology-long-run) how much the world can change within a lifetime, so it is worth taking seriously what those who work on AI expect for the future. Many AI experts [believe](/ai-timelines) there is a real chance that human-level artificial intelligence will be developed within the following decades, and some think it will exist much sooner. How such powerful AI systems are built and used will be very important for the future of our world and our own lives. All technologies have positive and negative consequences, but with AI, the range of these consequences is extraordinarily large: the technology has immense potential for good. Still, it comes with significant downsides and high risks. A technology that has such an enormous impact needs to be of central interest to people across our _entire_ society. But currently, the question of how this technology will get developed and used is left to a small group of entrepreneurs and engineers. With our publications on artificial intelligence, we want to help change this status quo and support a broader societal engagement. On this page, you will find articles and an overview of AI-related metrics that let you monitor what is happening and where we might be heading. We hope that this work will be helpful for the growing and necessary public conversation on AI. Related topics * [Technological Change](https://ourworldindata.org/technological-change) * [Technology Adoption](https://ourworldindata.org/technology-adoption) * [Economic Growth](https://ourworldindata.org/economic-growth) ## Research & Writing How AI gets built is currently decided by a small group of technologists. As this tech… | {"id": 54575, "date": "2022-12-06T07:51:00", "guid": {"rendered": "https://owid.cloud/?page_id=54575"}, "link": "https://owid.cloud/artificial-intelligence", "meta": {"owid_publication_context_meta_field": [], "owid_key_performance_indicators_meta_field": []}, "slug": "artificial-intelligence", "tags": [232], "type": "page", "title": {"rendered": "Artificial Intelligence"}, "_links": {"self": [{"href": "https://owid.cloud/wp-json/wp/v2/pages/54575"}], "about": [{"href": "https://owid.cloud/wp-json/wp/v2/types/page"}], "author": [{"href": "https://owid.cloud/wp-json/wp/v2/users/44", "embeddable": true}], "curies": [{"href": "https://api.w.org/{rel}", "name": "wp", "templated": true}], "replies": [{"href": "https://owid.cloud/wp-json/wp/v2/comments?post=54575", "embeddable": true}], "wp:term": [{"href": "https://owid.cloud/wp-json/wp/v2/categories?post=54575", "taxonomy": "category", "embeddable": true}, {"href": "https://owid.cloud/wp-json/wp/v2/tags?post=54575", "taxonomy": "post_tag", "embeddable": true}], "collection": [{"href": "https://owid.cloud/wp-json/wp/v2/pages"}], "wp:attachment": [{"href": "https://owid.cloud/wp-json/wp/v2/media?parent=54575"}], "version-history": [{"href": "https://owid.cloud/wp-json/wp/v2/pages/54575/revisions", "count": 30}], "wp:featuredmedia": [{"href": "https://owid.cloud/wp-json/wp/v2/media/54594", "embeddable": true}], "predecessor-version": [{"id": 57550, "href": "https://owid.cloud/wp-json/wp/v2/pages/54575/revisions/57550"}]}, "author": 44, "parent": 0, "status": "publish", "content": {"rendered": "\n<!-- formatting-options toc:false bodyClassName:topic-page -->\n\n\n\t<div class=\"sticky-nav-contents\">\n<li class=\" wp-block-navigation-item wp-block-navigation-link\"><a class=\"wp-block-navigation-item__content\" href=\"#introduction\"><span class=\"wp-block-navigation-item__label\">Introduction</span></a></li>\n\n<li class=\" wp-block-navigation-item wp-block-navigation-link\"><a class=\"wp-block-navigation-item__content\" href=\"#research-and-writing\"><span class=\"wp… | |
| 1148 | 1148 | 54367 | FAQs on the Living Planet Index | faq-living-planet-index | post | publish | <!-- wp:paragraph -->
<p>The Living Planet Index (LPI) is a measure of biodiversity that is often misinterpreted. In my <a href="https://ourworldindata.org/living-planet-index-decline">accompanying article</a> on the Living Planet Index, I describe these misinterpretations in detail, and what it actually tells us about the state of global biodiversity.</p>
<!-- /wp:paragraph -->
<!-- wp:paragraph -->
<p>In this short page I answer some commonly-asked questions about this measure of biodiversity.</p>
<!-- /wp:paragraph -->
<!-- wp:heading {"level":3} -->
<h3>What does the Living Planet Index (LPI) measure?</h3>
<!-- /wp:heading -->
<!-- wp:paragraph -->
<p>The Living Planet Index (LPI) provides a measure of wildlife <em>abundance</em>. It measures the <em>average</em> decline in population size since 1970 across a wide range of species.{ref}WWF (2022) <em>Living Planet Report 2022 – Building a nature-positive society</em>. Almond, R.E.A., Grooten, M., Juffe Bignoli, D. & Petersen, T. (Eds). WWF, Gland, Switzerland.{/ref}</p>
<!-- /wp:paragraph -->
<!-- wp:heading {"level":3} -->
<h3>What does the Living Planet Index (LPI) <em>not</em> measure?</h3>
<!-- /wp:heading -->
<!-- wp:paragraph -->
<p>The Living Planet Index does not measure:</p>
<!-- /wp:paragraph -->
<!-- wp:list -->
<ul><li>Number of species lost</li><li>Number of populations or individuals that have been lost</li><li>Number or percentage of species or populations that are declining</li><li>Number of extinctions</li></ul>
<!-- /wp:list -->
<!-- wp:heading {"level":3} -->
<h3>What types of species are included?</h3>
<!-- /wp:heading -->
<!-- wp:paragraph -->
<p>The LPI only includes data from vertebrate populations. This includes mammals, birds, reptiles, amphibians, and fish. Taxonomic groups including insects, corals, fungi, and plants are not included.</p>
<!-- /wp:paragraph -->
<!-- wp:heading {"level":3} -->
<h3>How many species does it cover? What is the geographical range of this coverage?</h3>
<!-- /wp:heading -->
<!-- wp:para… |
{"id": "wp-54367", "slug": "faq-living-planet-index", "content": {"toc": [], "body": [{"type": "text", "value": [{"text": "The Living Planet Index (LPI) is a measure of biodiversity that is often misinterpreted. In my ", "spanType": "span-simple-text"}, {"url": "https://ourworldindata.org/living-planet-index-decline", "children": [{"text": "accompanying article", "spanType": "span-simple-text"}], "spanType": "span-link"}, {"text": " on the Living Planet Index, I describe these misinterpretations in detail, and what it actually tells us about the state of global biodiversity.", "spanType": "span-simple-text"}], "parseErrors": []}, {"type": "text", "value": [{"text": "In this short page I answer some commonly-asked questions about this measure of biodiversity.", "spanType": "span-simple-text"}], "parseErrors": []}, {"text": [{"text": "What does the Living Planet Index (LPI) measure?", "spanType": "span-simple-text"}], "type": "heading", "level": 2, "parseErrors": []}, {"type": "text", "value": [{"text": "The Living Planet Index (LPI) provides a measure of wildlife ", "spanType": "span-simple-text"}, {"children": [{"text": "abundance", "spanType": "span-simple-text"}], "spanType": "span-italic"}, {"text": ". It measures the ", "spanType": "span-simple-text"}, {"children": [{"text": "average", "spanType": "span-simple-text"}], "spanType": "span-italic"}, {"text": " decline in population size since 1970 across a wide range of species.{ref}WWF (2022) ", "spanType": "span-simple-text"}, {"children": [{"text": "Living Planet Report 2022 – Building a nature-positive society", "spanType": "span-simple-text"}], "spanType": "span-italic"}, {"text": ". Almond, R.E.A., Grooten, M., Juffe Bignoli, D. & Petersen, T. (Eds). WWF, Gland, Switzerland.{/ref}", "spanType": "span-simple-text"}], "parseErrors": []}, {"text": [{"text": "What does the Living Planet Index (LPI) ", "spanType": "span-simple-text"}, {"children": [{"text": "not", "spanType": "span-simple-text"}], "spanType": "span-italic"}, {"text": " measure?", "spanType": "s… | {"errors": [{"name": "unexpected wp component tag", "details": "Found unhandled wp:comment tag list"}, {"name": "unexpected wp component tag", "details": "Found unhandled wp:comment tag table"}, {"name": "unexpected wp component tag", "details": "Found unhandled wp:comment tag table"}], "numBlocks": 22, "numErrors": 3, "wpTagCounts": {"list": 1, "table": 2, "heading": 8, "paragraph": 11}, "htmlTagCounts": {"p": 11, "h3": 8, "ul": 1, "table": 2, "figure": 2}} | 2022-10-13 12:59:00 | 2024-03-06 14:49:56 | 1WSnQyKck2OARVwI_ZTZ2zKY4VxT4f8v3nrfr6rHvZ-c | ["Hannah Ritchie"] | The Living Planet Index is one of the most common measures used in biodiversity monitoring. But what is it, and where does this data come from? | 2022-11-07 13:59:58 | 2023-06-15 09:45:46 | https://ourworldindata.org/wp-content/uploads/2021/03/Living-Planet-Index-thumbnail.png | {} | The Living Planet Index (LPI) is a measure of biodiversity that is often misinterpreted. In my [accompanying article](https://ourworldindata.org/living-planet-index-decline) on the Living Planet Index, I describe these misinterpretations in detail, and what it actually tells us about the state of global biodiversity. In this short page I answer some commonly-asked questions about this measure of biodiversity. ## What does the Living Planet Index (LPI) measure? The Living Planet Index (LPI) provides a measure of wildlife _abundance_. It measures the _average_ decline in population size since 1970 across a wide range of species.{ref}WWF (2022) _Living Planet Report 2022 – Building a nature-positive society_. Almond, R.E.A., Grooten, M., Juffe Bignoli, D. & Petersen, T. (Eds). WWF, Gland, Switzerland.{/ref} ## What does the Living Planet Index (LPI) _not_ measure? The Living Planet Index does not measure: * Number of species lost * Number of populations or individuals that have been lost * Number or percentage of species or populations that are declining * Number of extinctions ## What types of species are included? The LPI only includes data from vertebrate populations. This includes mammals, birds, reptiles, amphibians, and fish. Taxonomic groups including insects, corals, fungi, and plants are not included. ## How many species does it cover? What is the geographical range of this coverage? In its latest report, published in 2022, 31,821 populations across 5,230 species were included. It includes species and populations across all continents. This breakdown is given in the table. <div class="raw-html-table__container"><table><tbody><tr><td><strong>Region</strong></td><td><strong>Number of species included</strong></td></tr><tr><td>Global</td><td>5,230</td></tr><tr><td>Africa</td><td>510</td></tr><tr><td>North America</td><td>952</td></tr><tr><td>Latin America & Caribbean</td><td>1,261</td></tr><tr><td>Asia-Pacific</td><td>729</td></tr><tr><td>Europe and Central Asia</td><td>627</td></tr></tbody></ta… | {"id": 54367, "date": "2022-10-13T13:59:00", "guid": {"rendered": "https://owid.cloud/?p=54367"}, "link": "https://owid.cloud/faq-living-planet-index", "meta": {"owid_publication_context_meta_field": []}, "slug": "faq-living-planet-index", "tags": [], "type": "post", "title": {"rendered": "FAQs on the Living Planet Index"}, "_links": {"self": [{"href": "https://owid.cloud/wp-json/wp/v2/posts/54367"}], "about": [{"href": "https://owid.cloud/wp-json/wp/v2/types/post"}], "author": [{"href": "https://owid.cloud/wp-json/wp/v2/users/17", "embeddable": true}], "curies": [{"href": "https://api.w.org/{rel}", "name": "wp", "templated": true}], "replies": [{"href": "https://owid.cloud/wp-json/wp/v2/comments?post=54367", "embeddable": true}], "wp:term": [{"href": "https://owid.cloud/wp-json/wp/v2/categories?post=54367", "taxonomy": "category", "embeddable": true}, {"href": "https://owid.cloud/wp-json/wp/v2/tags?post=54367", "taxonomy": "post_tag", "embeddable": true}], "collection": [{"href": "https://owid.cloud/wp-json/wp/v2/posts"}], "wp:attachment": [{"href": "https://owid.cloud/wp-json/wp/v2/media?parent=54367"}], "version-history": [{"href": "https://owid.cloud/wp-json/wp/v2/posts/54367/revisions", "count": 4}], "wp:featuredmedia": [{"href": "https://owid.cloud/wp-json/wp/v2/media/42160", "embeddable": true}], "predecessor-version": [{"id": 57454, "href": "https://owid.cloud/wp-json/wp/v2/posts/54367/revisions/57454"}]}, "author": 17, "format": "standard", "status": "publish", "sticky": false, "content": {"rendered": "\n<p>The Living Planet Index (LPI) is a measure of biodiversity that is often misinterpreted. In my <a href=\"https://ourworldindata.org/living-planet-index-decline\">accompanying article</a> on the Living Planet Index, I describe these misinterpretations in detail, and what it actually tells us about the state of global biodiversity.</p>\n\n\n\n<p>In this short page I answer some commonly-asked questions about this measure of biodiversity.</p>\n\n\n\n<h3>What does the Living Planet Index (LPI) measure?</h… |
| 1147 | 1147 | 54361 | How does the Living Planet Index vary by region? | living-planet-index-region | post | publish | <!-- wp:paragraph -->
<p>The Living Planet Index (LPI) is a measure of biodiversity that is often misinterpreted. In my <a href="https://ourworldindata.org/living-planet-index-decline">accompanying article</a> on the Living Planet Index, I describe these misinterpretations in detail, and what it actually tells us about the state of global biodiversity.</p>
<!-- /wp:paragraph -->
<!-- wp:paragraph -->
<p>In brief, the LPI measures the <em>average</em> change in the size of studied animal populations. It does not tell us the total change in animal populations; the share of populations that have been lost; or anything about extinctions.</p>
<!-- /wp:paragraph -->
<!-- wp:paragraph -->
<p>The main headline result of the 2022 Living Planet Index report was that studied animal populations globally <a href="https://ourworldindata.org/grapher/global-living-planet-index">have seen</a> an <em>average</em> decline of 69% between 1970 and 2018.{ref}WWF (2022) <em>Living Planet Report 2022 – Building a nature-positive society</em>. Almond, R.E.A., Grooten, M., Juffe Bignoli, D. & Petersen, T. (Eds). WWF, Gland, Switzerland.{/ref}</p>
<!-- /wp:paragraph -->
<!-- wp:columns -->
<div class="wp-block-columns"><!-- wp:column -->
<div class="wp-block-column"><!-- wp:paragraph -->
<p>But these results vary a lot from region to region.</p>
<!-- /wp:paragraph -->
<!-- wp:paragraph -->
<p>In the chart we see the LPI given by region. This is measured relative to 1970, which is assigned a value of one.</p>
<!-- /wp:paragraph -->
<!-- wp:paragraph -->
<p><strong>Latin America and the Caribbean</strong></p>
<!-- /wp:paragraph -->
<!-- wp:paragraph -->
<p>Latin America and the Caribbean have seen the most severe decline of any region. It experienced an average decline of 94% across its studied populations. When we think about the changes in some of the leading drivers of biodiversity loss, we should not be surprised that Latin America has been badly affected.</p>
<!-- /wp:paragraph -->
<!-- wp:paragraph -->
<p>In recent deca… |
{"id": "wp-54361", "slug": "living-planet-index-region", "content": {"toc": [], "body": [{"type": "text", "value": [{"text": "The Living Planet Index (LPI) is a measure of biodiversity that is often misinterpreted. In my ", "spanType": "span-simple-text"}, {"url": "https://ourworldindata.org/living-planet-index-decline", "children": [{"text": "accompanying article", "spanType": "span-simple-text"}], "spanType": "span-link"}, {"text": " on the Living Planet Index, I describe these misinterpretations in detail, and what it actually tells us about the state of global biodiversity.", "spanType": "span-simple-text"}], "parseErrors": []}, {"type": "text", "value": [{"text": "In brief, the LPI measures the ", "spanType": "span-simple-text"}, {"children": [{"text": "average", "spanType": "span-simple-text"}], "spanType": "span-italic"}, {"text": " change in the size of studied animal populations. It does not tell us the total change in animal populations; the share of populations that have been lost; or anything about extinctions.", "spanType": "span-simple-text"}], "parseErrors": []}, {"type": "text", "value": [{"text": "The main headline result of the 2022 Living Planet Index report was that studied animal populations globally ", "spanType": "span-simple-text"}, {"url": "https://ourworldindata.org/grapher/global-living-planet-index", "children": [{"text": "have seen", "spanType": "span-simple-text"}], "spanType": "span-link"}, {"text": " an ", "spanType": "span-simple-text"}, {"children": [{"text": "average", "spanType": "span-simple-text"}], "spanType": "span-italic"}, {"text": " decline of 69% between 1970 and 2018.{ref}WWF (2022) ", "spanType": "span-simple-text"}, {"children": [{"text": "Living Planet Report 2022 – Building a nature-positive society", "spanType": "span-simple-text"}], "spanType": "span-italic"}, {"text": ". Almond, R.E.A., Grooten, M., Juffe Bignoli, D. & Petersen, T. (Eds). WWF, Gland, Switzerland.{/ref}", "spanType": "span-simple-text"}], "parseErrors": []}, {"left": [{"type": "text", "value": [{… | {"errors": [], "numBlocks": 6, "numErrors": 0, "wpTagCounts": {"html": 2, "column": 4, "columns": 2, "heading": 1, "paragraph": 27}, "htmlTagCounts": {"p": 27, "h3": 1, "div": 6, "iframe": 2}} | 2022-10-13 12:38:00 | 2024-03-06 14:02:35 | 1Dfymewkd1ZtUrmLSAc2VVCIejsbe2zLjqe8ioD1RnAw | ["Hannah Ritchie"] | The Living Planet Index shows an average decline of 69% across studied animal populations globally. But how does this vary by region? | 2022-11-07 13:40:18 | 2023-05-22 16:43:09 | https://ourworldindata.org/wp-content/uploads/2022/10/Living-planet-index-region-thumbnail.png | {} | The Living Planet Index (LPI) is a measure of biodiversity that is often misinterpreted. In my [accompanying article](https://ourworldindata.org/living-planet-index-decline) on the Living Planet Index, I describe these misinterpretations in detail, and what it actually tells us about the state of global biodiversity. In brief, the LPI measures the _average_ change in the size of studied animal populations. It does not tell us the total change in animal populations; the share of populations that have been lost; or anything about extinctions. The main headline result of the 2022 Living Planet Index report was that studied animal populations globally [have seen](https://ourworldindata.org/grapher/global-living-planet-index) an _average_ decline of 69% between 1970 and 2018.{ref}WWF (2022) _Living Planet Report 2022 – Building a nature-positive society_. Almond, R.E.A., Grooten, M., Juffe Bignoli, D. & Petersen, T. (Eds). WWF, Gland, Switzerland.{/ref} But these results vary a lot from region to region. In the chart we see the LPI given by region. This is measured relative to 1970, which is assigned a value of one. **Latin America and the Caribbean** Latin America and the Caribbean have seen the most severe decline of any region. It experienced an average decline of 94% across its studied populations. When we think about the changes in some of the leading drivers of biodiversity loss, we should not be surprised that Latin America has been badly affected. In recent decades it has experienced [intense deforestation](http://ourworldindata.org/deforestation) and expansion of agricultural land: the primary driver of habitat loss. It is also a biodiversity hotspot, being home to many endemic (unique) tropical species. These species are often highly specialized, and don’t adapt well to changes in local conditions. The LPI highlights the conversion of grasslands, forests, wetlands and the harvesting of species for hunting and poaching as the main contributors to this decline. It was most severe for fish, reptiles an… | {"id": 54361, "date": "2022-10-13T13:38:00", "guid": {"rendered": "https://owid.cloud/?p=54361"}, "link": "https://owid.cloud/living-planet-index-region", "meta": {"owid_publication_context_meta_field": []}, "slug": "living-planet-index-region", "tags": [], "type": "post", "title": {"rendered": "How does the Living Planet Index vary by region?"}, "_links": {"self": [{"href": "https://owid.cloud/wp-json/wp/v2/posts/54361"}], "about": [{"href": "https://owid.cloud/wp-json/wp/v2/types/post"}], "author": [{"href": "https://owid.cloud/wp-json/wp/v2/users/17", "embeddable": true}], "curies": [{"href": "https://api.w.org/{rel}", "name": "wp", "templated": true}], "replies": [{"href": "https://owid.cloud/wp-json/wp/v2/comments?post=54361", "embeddable": true}], "wp:term": [{"href": "https://owid.cloud/wp-json/wp/v2/categories?post=54361", "taxonomy": "category", "embeddable": true}, {"href": "https://owid.cloud/wp-json/wp/v2/tags?post=54361", "taxonomy": "post_tag", "embeddable": true}], "collection": [{"href": "https://owid.cloud/wp-json/wp/v2/posts"}], "wp:attachment": [{"href": "https://owid.cloud/wp-json/wp/v2/media?parent=54361"}], "version-history": [{"href": "https://owid.cloud/wp-json/wp/v2/posts/54361/revisions", "count": 8}], "wp:featuredmedia": [{"href": "https://owid.cloud/wp-json/wp/v2/media/54364", "embeddable": true}], "predecessor-version": [{"id": 57079, "href": "https://owid.cloud/wp-json/wp/v2/posts/54361/revisions/57079"}]}, "author": 17, "format": "standard", "status": "publish", "sticky": false, "content": {"rendered": "\n<p>The Living Planet Index (LPI) is a measure of biodiversity that is often misinterpreted. In my <a href=\"https://ourworldindata.org/living-planet-index-decline\">accompanying article</a> on the Living Planet Index, I describe these misinterpretations in detail, and what it actually tells us about the state of global biodiversity.</p>\n\n\n\n<p>In brief, the LPI measures the <em>average</em> change in the size of studied animal populations. It does not tell us the total change in… |
| 1146 | 1146 | 54262 | Global Health Explorer FAQ | global-health-explorer-faq | wp_block | publish | <!-- wp:heading {"level":3} -->
<h3>Data sources and methodological differences</h3>
<!-- /wp:heading -->
<!-- wp:paragraph -->
<p>We source the data for the Global Health Explorer from three main sources: </p>
<!-- /wp:paragraph -->
<!-- wp:list -->
<ul><li>World Health Organization’s Global Health Estimates</li><li>World Health Organization’s Global Health Observatory</li><li>Institute of Health Metrics and Evaluation’s Global Burden of Disease Study</li></ul>
<!-- /wp:list -->
<!-- wp:heading {"level":4} -->
<h4>Global Health Estimates (WHO GHE)</h4>
<!-- /wp:heading -->
<!-- wp:paragraph -->
<p>The Global Health Estimates are primarily calculated using cause-of-death statistics that are reported to the WHO by individual countries. </p>
<!-- /wp:paragraph -->
<!-- wp:paragraph -->
<p>These vital registration (VR) statistics are submitted to the WHO Mortality Database on an annual basis by country, year, cause, age and sex. This data is included in the Global Health Estimates if it meets criteria assessing completeness and quality. Since many countries don't meet these criteria, the GHE does not incorporate VR statistics for every country.</p>
<!-- /wp:paragraph -->
<!-- wp:paragraph -->
<p>There are a number of specialist WHO groups and UN agencies that collect topic or disease-specific data. The dataset on HIV and AIDS – collected and published by UN AIDS – is one example of this. The estimates based on the VR data are compared to the data from specialist WHO groups and UN agencies and adjustments are made if necessary. </p>
<!-- /wp:paragraph -->
<!-- wp:paragraph -->
<p>Where the VR data is not usable and there is no other nationally representative cause of death data, then the World Health Organization adopts the IHME’s Global Burden of Disease data to fill these gaps. Full details on how the WHO’s Global Health Estimates are calculated are available <a href="https://web.archive.org/web/20221028092355/https://cdn.who.int/media/docs/default-source/gho-documents/global-health-estimates/… |
{"id": "wp-54262", "slug": "global-health-explorer-faq", "content": {"toc": [], "body": [{"text": [{"text": "Data sources and methodological differences", "spanType": "span-simple-text"}], "type": "heading", "level": 2, "parseErrors": []}, {"type": "text", "value": [{"text": "We source the data for the Global Health Explorer from three main sources: ", "spanType": "span-simple-text"}], "parseErrors": []}, {"type": "list", "items": [{"type": "text", "value": [{"text": "World Health Organization’s Global Health Estimates", "spanType": "span-simple-text"}], "parseErrors": []}, {"type": "text", "value": [{"text": "World Health Organization’s Global Health Observatory", "spanType": "span-simple-text"}], "parseErrors": []}, {"type": "text", "value": [{"text": "Institute of Health Metrics and Evaluation’s Global Burden of Disease Study", "spanType": "span-simple-text"}], "parseErrors": []}], "parseErrors": []}, {"text": [{"text": "Global Health Estimates (WHO GHE)", "spanType": "span-simple-text"}], "type": "heading", "level": 3, "parseErrors": []}, {"type": "text", "value": [{"text": "The Global Health Estimates are primarily calculated using cause-of-death statistics that are reported to the WHO by individual countries. ", "spanType": "span-simple-text"}], "parseErrors": []}, {"type": "text", "value": [{"text": "These vital registration (VR) statistics are submitted to the WHO Mortality Database on an annual basis by country, year, cause, age and sex. This data is included in the Global Health Estimates if it meets criteria assessing completeness and quality. Since many countries don't meet these criteria, the GHE does not incorporate VR statistics for every country.", "spanType": "span-simple-text"}], "parseErrors": []}, {"type": "text", "value": [{"text": "There are a number of specialist WHO groups and UN agencies that collect topic or disease-specific data. The dataset on HIV and AIDS – collected and published by UN AIDS – is one example of this. The estimates based on the VR data are compared to the data from spe… | {"errors": [{"name": "unexpected wp component tag", "details": "Found unhandled wp:comment tag list"}], "numBlocks": 25, "numErrors": 1, "wpTagCounts": {"list": 1, "heading": 6, "paragraph": 18}, "htmlTagCounts": {"p": 18, "h3": 1, "h4": 5, "ul": 1}} | 2022-11-01 11:31:37 | 2024-12-02 19:39:03 | [null] | 2022-11-01 11:35:57 | 2022-11-02 16:28:46 | {} | ## Data sources and methodological differences We source the data for the Global Health Explorer from three main sources: * World Health Organization’s Global Health Estimates * World Health Organization’s Global Health Observatory * Institute of Health Metrics and Evaluation’s Global Burden of Disease Study ### Global Health Estimates (WHO GHE) The Global Health Estimates are primarily calculated using cause-of-death statistics that are reported to the WHO by individual countries. These vital registration (VR) statistics are submitted to the WHO Mortality Database on an annual basis by country, year, cause, age and sex. This data is included in the Global Health Estimates if it meets criteria assessing completeness and quality. Since many countries don't meet these criteria, the GHE does not incorporate VR statistics for every country. There are a number of specialist WHO groups and UN agencies that collect topic or disease-specific data. The dataset on HIV and AIDS – collected and published by UN AIDS – is one example of this. The estimates based on the VR data are compared to the data from specialist WHO groups and UN agencies and adjustments are made if necessary. Where the VR data is not usable and there is no other nationally representative cause of death data, then the World Health Organization adopts the IHME’s Global Burden of Disease data to fill these gaps. Full details on how the WHO’s Global Health Estimates are calculated are available [here](https://web.archive.org/web/20221028092355/https://cdn.who.int/media/docs/default-source/gho-documents/global-health-estimates/ghe2019_cod_methods.pdf?sfvrsn=37bcfacc_5). ### Global Health Observatory (WHO GHO) The WHO’s Global Health Observatory brings together a large number of variables produced by the WHO and specialist UN agencies. The variables found within the Global Health Observatory are limited to the leading causes of death and injury. This means the WHO GHO is less ‘complete’ than the IHME Global Burden of Disease study and WHO GHE in … | {"data": {"wpBlock": {"content": "<h3>Data sources and methodological differences</h3>\n\n<p>We source the data for the Global Health Explorer from three main sources: </p>\n\n<ul><li>World Health Organization’s Global Health Estimates</li><li>World Health Organization’s Global Health Observatory</li><li>Institute of Health Metrics and Evaluation’s Global Burden of Disease Study</li></ul>\n\n<h4>Global Health Estimates (WHO GHE)</h4>\n\n<p>The Global Health Estimates are primarily calculated using cause-of-death statistics that are reported to the WHO by individual countries. </p>\n\n<p>These vital registration (VR) statistics are submitted to the WHO Mortality Database on an annual basis by country, year, cause, age and sex. This data is included in the Global Health Estimates if it meets criteria assessing completeness and quality. Since many countries don’t meet these criteria, the GHE does not incorporate VR statistics for every country.</p>\n\n<p>There are a number of specialist WHO groups and UN agencies that collect topic or disease-specific data. The dataset on HIV and AIDS – collected and published by UN AIDS – is one example of this. The estimates based on the VR data are compared to the data from specialist WHO groups and UN agencies and adjustments are made if necessary. </p>\n\n<p>Where the VR data is not usable and there is no other nationally representative cause of death data, then the World Health Organization adopts the IHME’s Global Burden of Disease data to fill these gaps. Full details on how the WHO’s Global Health Estimates are calculated are available <a href=\"https://www.who.int/data/global-health-estimates\">here</a>.</p>\n\n<h4>Global Health Observatory (WHO GHO)</h4>\n\n<p>The WHO’s Global Health Observatory brings together a large number of variables produced by the WHO and specialist UN agencies. </p>\n\n<p>The variables found within the Global Health Observatory are limited to the leading causes of death and injury. This means the WHO GHO is less ‘complete… | |||
| 1145 | 1145 | 54245 | The 'Varieties of Democracy' data: how do researchers measure democracy? | vdem-electoral-democracy-data | post | publish | <!-- wp:columns -->
<div class="wp-block-columns"><!-- wp:column -->
<div class="wp-block-column"><!-- wp:paragraph -->
<p>Measuring the state of democracy across the world helps us understand the extent to which people have political rights and freedoms.</p>
<!-- /wp:paragraph -->
<!-- wp:paragraph -->
<p>But measuring democracy comes with many challenges. People do not always agree on what characteristics define a democracy. These characteristics — such as whether an election was free and fair — are difficult to define and assess. The judgment of experts is to some degree subjective. They may disagree about a specific characteristic or how something as complex as a political system can be reduced into a single measure.</p>
<!-- /wp:paragraph -->
<!-- wp:paragraph -->
<p>How do researchers address these challenges and measure democracy?</p>
<!-- /wp:paragraph -->
<!-- wp:heading {"level":4} -->
<h4><strong>What is the Varieties of Democracy (V-Dem) project?</strong></h4>
<!-- /wp:heading -->
<!-- wp:paragraph -->
<p>In some of our work on democracy, we rely on data published by the <a href="https://www.v-dem.net/vdemds.html">Varieties of Democracy (V-Dem) project</a>.{ref}Coppedge, Michael, John Gerring, Carl Henrik Knutsen, Staffan I. Lindberg, Jan Teorell, David Altman, Michael Bernhard, Agnes Cornell, M. Steven Fish, Lisa Gastaldi, Haakon Gjerløw, Adam Glynn, Ana Good God, Sandra Grahn, Allen Hicken, Katrin Kinzelbach, Joshua Krusell, Kyle L. Marquardt, Kelly McMann, Valeriya Mechkova, Juraj Medzihorsky, Natalia Natsika, Anja Neundorf, Pamela Paxton, Daniel Pemstein, Josefine Pernes, Oskar Rydén, Johannes von Römer, Brigitte Seim, Rachel Sigman, Svend-Erik Skaaning, Jeffrey Staton, Aksel Sundström, Eitan Tzelgov, Yi-ting Wang, Tore Wig, Steven Wilson and Daniel Ziblatt. 2023. <a href="https://scholar.google.com/scholar?hl=en&as_sdt=0%2C5&q=Coppedge%2C+Michael%2C+John+Gerring%2C+Carl+Henrik+Knutsen%2C+Staffan+I.+Lindberg%2C+Jan+Teorell%2C+David+Altman%2C+Michael+Bernhard%2C+Agnes+Cornell%2C+M.+Stev… |
{"id": "wp-54245", "slug": "vdem-electoral-democracy-data", "content": {"toc": [], "body": [{"type": "text", "value": [{"text": "Measuring the state of democracy across the world helps us understand the extent to which people have political rights and freedoms.", "spanType": "span-simple-text"}], "parseErrors": []}, {"type": "text", "value": [{"text": "But measuring democracy comes with many challenges. People do not always agree on what characteristics define a democracy. These characteristics — such as whether an election was free and fair — are difficult to define and assess. The judgment of experts is to some degree subjective. They may disagree about a specific characteristic or how something as complex as a political system can be reduced into a single measure.", "spanType": "span-simple-text"}], "parseErrors": []}, {"type": "text", "value": [{"text": "How do researchers address these challenges and measure democracy?", "spanType": "span-simple-text"}], "parseErrors": []}, {"text": [{"children": [{"text": "What is the Varieties of Democracy (V-Dem) project?", "spanType": "span-simple-text"}], "spanType": "span-bold"}], "type": "heading", "level": 2, "parseErrors": []}, {"type": "text", "value": [{"text": "In some of our work on democracy, we rely on data published by the ", "spanType": "span-simple-text"}, {"url": "https://www.v-dem.net/vdemds.html", "children": [{"text": "Varieties of Democracy (V-Dem) project", "spanType": "span-simple-text"}], "spanType": "span-link"}, {"text": ".{ref}Coppedge, Michael, John Gerring, Carl Henrik Knutsen, Staffan I. Lindberg, Jan Teorell, David Altman, Michael Bernhard, Agnes Cornell, M. Steven Fish, Lisa Gastaldi, Haakon Gjerløw, Adam Glynn, Ana Good God, Sandra Grahn, Allen Hicken, Katrin Kinzelbach, Joshua Krusell, Kyle L. Marquardt, Kelly McMann, Valeriya Mechkova, Juraj Medzihorsky, Natalia Natsika, Anja Neundorf, Pamela Paxton, Daniel Pemstein, Josefine Pernes, Oskar Rydén, Johannes von Römer, Brigitte Seim, Rachel Sigman, Svend-Erik Skaaning, Jeffrey Staton, Aksel … | {"errors": [{"name": "unexpected wp component tag", "details": "Found unhandled wp:comment tag list"}, {"name": "columns block expects 2 children", "details": "Got 1 children instead"}], "numBlocks": 87, "numErrors": 2, "wpTagCounts": {"html": 2, "list": 1, "column": 1, "columns": 1, "heading": 17, "paragraph": 66, "owid/prominent-link": 1}, "htmlTagCounts": {"p": 66, "h4": 13, "h5": 4, "ul": 1, "div": 2, "iframe": 2}} | 2022-11-30 12:54:36 | 2024-02-16 14:22:54 | 14zTYMg-mkPcMC68DqgQNb1eAe8VBwoD93yzyKGIeguw | ["Bastian Herre"] | There are many ways to measure democracy. Here is how the Varieties of Democracy project does it, one of the leading sources of global democracy data. | 2022-11-01 09:38:34 | 2023-06-08 09:56:26 | https://ourworldindata.org/wp-content/uploads/2022/07/democratic_world.png | {} | Measuring the state of democracy across the world helps us understand the extent to which people have political rights and freedoms. But measuring democracy comes with many challenges. People do not always agree on what characteristics define a democracy. These characteristics — such as whether an election was free and fair — are difficult to define and assess. The judgment of experts is to some degree subjective. They may disagree about a specific characteristic or how something as complex as a political system can be reduced into a single measure. How do researchers address these challenges and measure democracy? ## **What is the Varieties of Democracy (V-Dem) project?** In some of our work on democracy, we rely on data published by the [Varieties of Democracy (V-Dem) project](https://www.v-dem.net/vdemds.html).{ref}Coppedge, Michael, John Gerring, Carl Henrik Knutsen, Staffan I. Lindberg, Jan Teorell, David Altman, Michael Bernhard, Agnes Cornell, M. Steven Fish, Lisa Gastaldi, Haakon Gjerløw, Adam Glynn, Ana Good God, Sandra Grahn, Allen Hicken, Katrin Kinzelbach, Joshua Krusell, Kyle L. Marquardt, Kelly McMann, Valeriya Mechkova, Juraj Medzihorsky, Natalia Natsika, Anja Neundorf, Pamela Paxton, Daniel Pemstein, Josefine Pernes, Oskar Rydén, Johannes von Römer, Brigitte Seim, Rachel Sigman, Svend-Erik Skaaning, Jeffrey Staton, Aksel Sundström, Eitan Tzelgov, Yi-ting Wang, Tore Wig, Steven Wilson and Daniel Ziblatt. 2023. [V-Dem [Country-Year/Country-Date] Dataset v13.](https://scholar.google.com/scholar?hl=en&as_sdt=0%2C5&q=Coppedge%2C+Michael%2C+John+Gerring%2C+Carl+Henrik+Knutsen%2C+Staffan+I.+Lindberg%2C+Jan+Teorell%2C+David+Altman%2C+Michael+Bernhard%2C+Agnes+Cornell%2C+M.+Steven+Fish%2C+Lisa+Gastaldi%2C+Haakon+Gjerl%C3%B8w%2C+Adam+Glynn%2C+Ana+Good+God%2C+Sandra+Grahn%2C+Allen+Hicken%2C+Katrin+Kinzelbach%2C+Joshua+Krusell%2C+Kyle+L.+Marquardt%2C+Kelly+McMann%2C+Valeriya+Mechkova%2C+Juraj+Medzihorsky%2C+Natalia+Natsika%2C+Anja+Neundorf%2C+Pamela+Paxton%2C+Daniel+Pemstein%2C+Josefine+Pernes%2C+Oskar+Ry… | {"id": 54245, "date": "2022-11-30T12:54:36", "guid": {"rendered": "https://owid.cloud/?p=54245"}, "link": "https://owid.cloud/vdem-electoral-democracy-data", "meta": {"owid_publication_context_meta_field": []}, "slug": "vdem-electoral-democracy-data", "tags": [], "type": "post", "title": {"rendered": "The ‘Varieties of Democracy’ data: how do researchers measure democracy?"}, "_links": {"self": [{"href": "https://owid.cloud/wp-json/wp/v2/posts/54245"}], "about": [{"href": "https://owid.cloud/wp-json/wp/v2/types/post"}], "author": [{"href": "https://owid.cloud/wp-json/wp/v2/users/49", "embeddable": true}], "curies": [{"href": "https://api.w.org/{rel}", "name": "wp", "templated": true}], "replies": [{"href": "https://owid.cloud/wp-json/wp/v2/comments?post=54245", "embeddable": true}], "wp:term": [{"href": "https://owid.cloud/wp-json/wp/v2/categories?post=54245", "taxonomy": "category", "embeddable": true}, {"href": "https://owid.cloud/wp-json/wp/v2/tags?post=54245", "taxonomy": "post_tag", "embeddable": true}], "collection": [{"href": "https://owid.cloud/wp-json/wp/v2/posts"}], "wp:attachment": [{"href": "https://owid.cloud/wp-json/wp/v2/media?parent=54245"}], "version-history": [{"href": "https://owid.cloud/wp-json/wp/v2/posts/54245/revisions", "count": 29}], "wp:featuredmedia": [{"href": "https://owid.cloud/wp-json/wp/v2/media/52089", "embeddable": true}], "predecessor-version": [{"id": 57350, "href": "https://owid.cloud/wp-json/wp/v2/posts/54245/revisions/57350"}]}, "author": 49, "format": "standard", "status": "publish", "sticky": false, "content": {"rendered": "\n<div class=\"wp-block-columns\">\n<div class=\"wp-block-column\">\n<p>Measuring the state of democracy across the world helps us understand the extent to which people have political rights and freedoms.</p>\n\n\n\n<p>But measuring democracy comes with many challenges. People do not always agree on what characteristics define a democracy. These characteristics — such as whether an election was free and fair — are difficult to define and ass… |
| 1143 | 1143 | 54076 | We just published a data explorer on Global Health | global-health-explorer-launch | post | publish | {"id": "wp-54076", "slug": "global-health-explorer-launch", "content": {"toc": [], "body": [], "type": "article", "title": "We just published a data explorer on Global Health", "authors": ["Fiona Spooner", "Edouard Mathieu", "Hannah Ritchie"], "excerpt": "What do people die from? How do health outcomes and systems vary across the world? Explore data for all countries in our data explorer.", "dateline": "November 2, 2022", "subtitle": "What do people die from? How do health outcomes and systems vary across the world? Explore data for all countries in our data explorer.", "sidebar-toc": false, "featured-image": "Global-Health-Explorer.png"}, "createdAt": "2022-10-25T16:35:11.000Z", "published": false, "updatedAt": "2022-11-02T11:28:15.000Z", "revisionId": null, "publishedAt": "2022-11-02T10:30:00.000Z", "relatedCharts": [], "publicationContext": "listed"} | {"errors": [], "numBlocks": 0, "numErrors": 0, "wpTagCounts": {}, "htmlTagCounts": {}} | 2022-11-02 10:30:00 | 2024-02-16 14:22:54 | ["Fiona Spooner", "Edouard Mathieu", "Hannah Ritchie"] | What do people die from? How do health outcomes and systems vary across the world? Explore data for all countries in our data explorer. | 2022-10-25 16:35:11 | 2022-11-02 11:28:15 | https://ourworldindata.org/wp-content/uploads/2022/10/Global-Health-Explorer.png | {} | {"id": 54076, "date": "2022-11-02T10:30:00", "guid": {"rendered": "https://owid.cloud/?p=54076"}, "link": "https://owid.cloud/global-health-explorer-launch", "meta": {"owid_publication_context_meta_field": {"latest": true, "homepage": true, "immediate_newsletter": true}}, "slug": "global-health-explorer-launch", "tags": [], "type": "post", "title": {"rendered": "We just published a data explorer on Global Health"}, "_links": {"self": [{"href": "https://owid.cloud/wp-json/wp/v2/posts/54076"}], "about": [{"href": "https://owid.cloud/wp-json/wp/v2/types/post"}], "author": [{"href": "https://owid.cloud/wp-json/wp/v2/users/53", "embeddable": true}], "curies": [{"href": "https://api.w.org/{rel}", "name": "wp", "templated": true}], "replies": [{"href": "https://owid.cloud/wp-json/wp/v2/comments?post=54076", "embeddable": true}], "wp:term": [{"href": "https://owid.cloud/wp-json/wp/v2/categories?post=54076", "taxonomy": "category", "embeddable": true}, {"href": "https://owid.cloud/wp-json/wp/v2/tags?post=54076", "taxonomy": "post_tag", "embeddable": true}], "collection": [{"href": "https://owid.cloud/wp-json/wp/v2/posts"}], "wp:attachment": [{"href": "https://owid.cloud/wp-json/wp/v2/media?parent=54076"}], "version-history": [{"href": "https://owid.cloud/wp-json/wp/v2/posts/54076/revisions", "count": 2}], "wp:featuredmedia": [{"href": "https://owid.cloud/wp-json/wp/v2/media/54241", "embeddable": true}], "predecessor-version": [{"id": 54079, "href": "https://owid.cloud/wp-json/wp/v2/posts/54076/revisions/54079"}]}, "author": 53, "format": "standard", "status": "publish", "sticky": false, "content": {"rendered": "", "protected": false}, "excerpt": {"rendered": "What do people die from? How do health outcomes and systems vary across the world? Explore data for all countries in our data explorer.", "protected": false}, "date_gmt": "2022-11-02T10:30:00", "modified": "2022-11-02T11:28:15", "template": "", "categories": [1], "ping_status": "closed", "authors_name": ["Fiona Spooner", "Edouard Mathieu", "Hannah Ritchie"], "modifie… | |||
| 1142 | 1142 | 53807 | We just published our new data explorer on Poverty | poverty-explorer-launch | post | publish | {"id": "wp-53807", "slug": "poverty-explorer-launch", "content": {"toc": [], "body": [], "type": "article", "title": "We just published our new data explorer on Poverty", "authors": ["Joe Hasell", "Pablo Arriagada"], "excerpt": "Explore data on poverty across the world, and how this is changing over time.", "dateline": "October 18, 2022", "subtitle": "Explore data on poverty across the world, and how this is changing over time.", "sidebar-toc": false, "featured-image": "chart.png"}, "createdAt": "2022-10-17T12:18:26.000Z", "published": false, "updatedAt": "2022-10-18T10:52:13.000Z", "revisionId": null, "publishedAt": "2022-10-18T09:58:00.000Z", "relatedCharts": [], "publicationContext": "listed"} | {"errors": [], "numBlocks": 0, "numErrors": 0, "wpTagCounts": {}, "htmlTagCounts": {}} | 2022-10-18 09:58:00 | 2024-02-16 14:22:54 | ["Joe Hasell", "Pablo Arriagada"] | Explore data on poverty across the world, and how this is changing over time. | 2022-10-17 12:18:26 | 2022-10-18 10:52:13 | https://ourworldindata.org/wp-content/uploads/2022/10/chart.png | {} | {"id": 53807, "date": "2022-10-18T10:58:00", "guid": {"rendered": "https://owid.cloud/?p=53807"}, "link": "https://owid.cloud/poverty-explorer-launch", "meta": {"owid_publication_context_meta_field": {"latest": true, "homepage": true, "immediate_newsletter": true}}, "slug": "poverty-explorer-launch", "tags": [], "type": "post", "title": {"rendered": "We just published our new data explorer on Poverty"}, "_links": {"self": [{"href": "https://owid.cloud/wp-json/wp/v2/posts/53807"}], "about": [{"href": "https://owid.cloud/wp-json/wp/v2/types/post"}], "author": [{"href": "https://owid.cloud/wp-json/wp/v2/users/14", "embeddable": true}], "curies": [{"href": "https://api.w.org/{rel}", "name": "wp", "templated": true}], "replies": [{"href": "https://owid.cloud/wp-json/wp/v2/comments?post=53807", "embeddable": true}], "wp:term": [{"href": "https://owid.cloud/wp-json/wp/v2/categories?post=53807", "taxonomy": "category", "embeddable": true}, {"href": "https://owid.cloud/wp-json/wp/v2/tags?post=53807", "taxonomy": "post_tag", "embeddable": true}], "collection": [{"href": "https://owid.cloud/wp-json/wp/v2/posts"}], "wp:attachment": [{"href": "https://owid.cloud/wp-json/wp/v2/media?parent=53807"}], "version-history": [{"href": "https://owid.cloud/wp-json/wp/v2/posts/53807/revisions", "count": 3}], "wp:featuredmedia": [{"href": "https://owid.cloud/wp-json/wp/v2/media/53946", "embeddable": true}], "predecessor-version": [{"id": 53811, "href": "https://owid.cloud/wp-json/wp/v2/posts/53807/revisions/53811"}]}, "author": 14, "format": "standard", "status": "publish", "sticky": false, "content": {"rendered": "", "protected": false}, "excerpt": {"rendered": "Explore data on poverty across the world, and how this is changing over time.", "protected": false}, "date_gmt": "2022-10-18T09:58:00", "modified": "2022-10-18T11:52:13", "template": "", "categories": [1], "ping_status": "closed", "authors_name": ["Joe Hasell", "Pablo Arriagada"], "modified_gmt": "2022-10-18T10:52:13", "comment_status": "closed", "featured_media": 53946, "featur… | |||
| 1141 | 1141 | 53796 | Introducing our updated work on Poverty: a new design for our content | owid-entry-redesign | post | publish | <!-- wp:owid/help -->
<!-- wp:heading {"level":4} -->
<h4>Authors of this work</h4>
<!-- /wp:heading -->
<!-- wp:paragraph {"placeholder":"Enter help content..."} -->
<p>This redesign project was built by Joe Hasell, Matthew Conlen, Marwa Boukarim, Matthieu Bergel, Ike Saunders, Daniel Bachler, Pablo Arriagada, and Max Roser.</p>
<!-- /wp:paragraph -->
<!-- /wp:owid/help -->
<!-- wp:paragraph -->
<p>At <em>Our World in Data</em>, we present data and research in a number of ways: as individual charts, data explorers that allow users to switch between metrics, technical articles that explain what particular metrics mean, and articles that explain what the data tells us about the world to make progress.</p>
<!-- /wp:paragraph -->
<!-- wp:paragraph -->
<p>We have more than 3,000 interactive charts spanning hundreds of topics.</p>
<!-- /wp:paragraph -->
<!-- wp:paragraph -->
<p>One of our biggest challenges has been bringing all of this data and research together in a way that users can navigate easily. People should be able to quickly find exactly what they’re looking for. And be able to find it again when they come back.</p>
<!-- /wp:paragraph -->
<!-- wp:paragraph -->
<p>To help solve this challenge, over the past year, our product and engineering teams have been working on the design of a new format for collecting and presenting all our data, research, and writing on particular topics.</p>
<!-- /wp:paragraph -->
<!-- wp:paragraph -->
<p>We’ve now published the first example of this redesign for one topic – <a href="https://ourworldindata.org/poverty" data-type="URL" data-id="https://ourworldindata.org/poverty">Poverty</a>.</p>
<!-- /wp:paragraph -->
<!-- wp:paragraph -->
<p>We plan to progressively roll this design out across the other topics on our site in the next year.</p>
<!-- /wp:paragraph -->
<!-- wp:owid/prominent-link {"title":"","linkUrl":"https://ourworldindata.org/poverty","className":"is-style-thin"} -->
<!-- wp:paragraph -->
<p></p>
<!-- /wp:paragraph -->
<!-- /wp:owid/prominent-link -->
<!--… |
{"id": "wp-53796", "slug": "owid-entry-redesign", "content": {"toc": [], "body": [{"text": [{"text": "Authors of this work", "spanType": "span-simple-text"}], "type": "heading", "level": 3, "parseErrors": []}, {"type": "text", "value": [{"text": "This redesign project was built by Joe Hasell, Matthew Conlen, Marwa Boukarim, Matthieu Bergel, Ike Saunders, Daniel Bachler, Pablo Arriagada, and Max Roser.", "spanType": "span-simple-text"}], "parseErrors": []}, {"type": "text", "value": [{"text": "At ", "spanType": "span-simple-text"}, {"children": [{"text": "Our World in Data", "spanType": "span-simple-text"}], "spanType": "span-italic"}, {"text": ", we present data and research in a number of ways: as individual charts, data explorers that allow users to switch between metrics, technical articles that explain what particular metrics mean, and articles that explain what the data tells us about the world to make progress.", "spanType": "span-simple-text"}], "parseErrors": []}, {"type": "text", "value": [{"text": "We have more than 3,000 interactive charts spanning hundreds of topics.", "spanType": "span-simple-text"}], "parseErrors": []}, {"type": "text", "value": [{"text": "One of our biggest challenges has been bringing all of this data and research together in a way that users can navigate easily. People should be able to quickly find exactly what they’re looking for. And be able to find it again when they come back.", "spanType": "span-simple-text"}], "parseErrors": []}, {"type": "text", "value": [{"text": "To help solve this challenge, over the past year, our product and engineering teams have been working on the design of a new format for collecting and presenting all our data, research, and writing on particular topics.", "spanType": "span-simple-text"}], "parseErrors": []}, {"type": "text", "value": [{"text": "We’ve now published the first example of this redesign for one topic – ", "spanType": "span-simple-text"}, {"url": "https://ourworldindata.org/poverty", "children": [{"text": "Poverty", "spanType": "span… | {"errors": [{"name": "unexpected wp component tag", "details": "Found unhandled wp:comment tag owid/help"}, {"name": "unexpected wp component tag", "details": "Found unhandled wp:comment tag image"}, {"name": "unexpected wp component tag", "details": "Found unhandled wp:comment tag image"}, {"name": "unexpected wp component tag", "details": "Found unhandled wp:comment tag image"}], "numBlocks": 20, "numErrors": 4, "wpTagCounts": {"image": 3, "column": 8, "columns": 4, "heading": 4, "owid/help": 1, "paragraph": 18, "owid/prominent-link": 2}, "htmlTagCounts": {"p": 18, "h3": 1, "h4": 3, "div": 12, "figure": 3}} | 2022-10-18 10:00:00 | 2024-02-22 05:48:06 | 1FfeqfpB_bjsB-XGIQ2PoYZeNi3pCnBBf-pv9my0jGcg | ["Joe Hasell", "Matthew Conlen"] | We’ve just published a major redesign of our topic pages. Explore this redesign with our new work on poverty. | 2022-10-17 12:09:56 | 2022-10-18 12:28:09 | https://ourworldindata.org/wp-content/uploads/2022/10/new-design-1.png | {} | ### Authors of this work This redesign project was built by Joe Hasell, Matthew Conlen, Marwa Boukarim, Matthieu Bergel, Ike Saunders, Daniel Bachler, Pablo Arriagada, and Max Roser. At _Our World in Data_, we present data and research in a number of ways: as individual charts, data explorers that allow users to switch between metrics, technical articles that explain what particular metrics mean, and articles that explain what the data tells us about the world to make progress. We have more than 3,000 interactive charts spanning hundreds of topics. One of our biggest challenges has been bringing all of this data and research together in a way that users can navigate easily. People should be able to quickly find exactly what they’re looking for. And be able to find it again when they come back. To help solve this challenge, over the past year, our product and engineering teams have been working on the design of a new format for collecting and presenting all our data, research, and writing on particular topics. We’ve now published the first example of this redesign for one topic – [Poverty](https://ourworldindata.org/poverty). We plan to progressively roll this design out across the other topics on our site in the next year. ### https://ourworldindata.org/poverty ## What do we want to achieve with this redesign? At _Our World in Data, _we strive to make data both easy to access and easy to understand. And we want to make the information that we’re presenting useful to a wide range of people, from the government official who wants to make a policy decision informed by the best available data to a curious reader who wants to understand what is going on in the world around them. One of _Our World in Data_’s biggest contributions is that we provide important context – of methodological challenges, data quality, and key insights – to the data and research that we present. This redesign aims to make sure that these important insights and technical details are easily discoverable without overwhelming readers… | {"id": 53796, "date": "2022-10-18T11:00:00", "guid": {"rendered": "https://owid.cloud/?p=53796"}, "link": "https://owid.cloud/owid-entry-redesign", "meta": {"owid_publication_context_meta_field": {"latest": true, "homepage": true, "immediate_newsletter": true}}, "slug": "owid-entry-redesign", "tags": [], "type": "post", "title": {"rendered": "Introducing our updated work on Poverty: a new design for our content"}, "_links": {"self": [{"href": "https://owid.cloud/wp-json/wp/v2/posts/53796"}], "about": [{"href": "https://owid.cloud/wp-json/wp/v2/types/post"}], "author": [{"href": "https://owid.cloud/wp-json/wp/v2/users/14", "embeddable": true}], "curies": [{"href": "https://api.w.org/{rel}", "name": "wp", "templated": true}], "replies": [{"href": "https://owid.cloud/wp-json/wp/v2/comments?post=53796", "embeddable": true}], "wp:term": [{"href": "https://owid.cloud/wp-json/wp/v2/categories?post=53796", "taxonomy": "category", "embeddable": true}, {"href": "https://owid.cloud/wp-json/wp/v2/tags?post=53796", "taxonomy": "post_tag", "embeddable": true}], "collection": [{"href": "https://owid.cloud/wp-json/wp/v2/posts"}], "wp:attachment": [{"href": "https://owid.cloud/wp-json/wp/v2/media?parent=53796"}], "version-history": [{"href": "https://owid.cloud/wp-json/wp/v2/posts/53796/revisions", "count": 10}], "wp:featuredmedia": [{"href": "https://owid.cloud/wp-json/wp/v2/media/53947", "embeddable": true}], "predecessor-version": [{"id": 53951, "href": "https://owid.cloud/wp-json/wp/v2/posts/53796/revisions/53951"}]}, "author": 14, "format": "standard", "status": "publish", "sticky": false, "content": {"rendered": "\t<block type=\"help\">\n\t\t<content>\n\n<h4>Authors of this work</h4>\n\n\n\n<p>This redesign project was built by Joe Hasell, Matthew Conlen, Marwa Boukarim, Matthieu Bergel, Ike Saunders, Daniel Bachler, Pablo Arriagada, and Max Roser.</p>\n\n</content>\n\t</block>\n\n\n<p>At <em>Our World in Data</em>, we present data and research in a number of ways: as individual charts, data explorers that allow users to sw… |
| 1140 | 1140 | 53780 | World Bank PIP data still in 2011 PPPs warning | world-bank-pip-data-still-in-2011-ppps-warning | wp_block | publish | <!-- wp:owid/help -->
<!-- wp:heading {"level":4} -->
<h4>The World Bank has updated its poverty and inequality data</h4>
<!-- /wp:heading -->
<!-- wp:paragraph -->
<p>The data in this article uses a previous release of the World Bank's poverty and inequality data in which incomes are expressed in 2011 international-$.</p>
<!-- /wp:paragraph -->
<!-- wp:paragraph -->
<p>The World Bank has since updated its methods, and now measures incomes in 2017 international-$. As part of this change, the International Poverty Line used to measure extreme poverty has also been updated: from $1.90 (in 2011 prices) to $2.15 (in 2017 prices).</p>
<!-- /wp:paragraph -->
<!-- wp:paragraph -->
<p>This has had little effect on our overall understanding of poverty and inequality around the world. But because of the change of units, many of the figures mentioned in this article will differ from the latest World Bank figures.</p>
<!-- /wp:paragraph -->
<!-- wp:owid/prominent-link {"title":"","linkUrl":"https://ourworldindata.org/from-1-90-to-2-15-a-day-the-updated-international-poverty-line","className":"is-style-thin"} -->
<!-- wp:paragraph -->
<p>Read more about the World Bank's updated methodology</p>
<!-- /wp:paragraph -->
<!-- /wp:owid/prominent-link -->
<!-- wp:owid/prominent-link {"title":"Explore the latest World Bank data on poverty and inequality","linkUrl":"https://ourworldindata.org/explorers/poverty-explorer","className":"is-style-thin"} -->
<!-- wp:paragraph -->
<p></p>
<!-- /wp:paragraph -->
<!-- /wp:owid/prominent-link -->
<!-- /wp:owid/help --> |
{"id": "wp-53780", "slug": "world-bank-pip-data-still-in-2011-ppps-warning", "content": {"toc": [], "body": [{"text": [{"text": "The World Bank has updated its poverty and inequality data", "spanType": "span-simple-text"}], "type": "heading", "level": 2, "parseErrors": []}, {"type": "text", "value": [{"text": "The data in this article uses a previous release of the World Bank's poverty and inequality data in which incomes are expressed in 2011 international-$.", "spanType": "span-simple-text"}], "parseErrors": []}, {"type": "text", "value": [{"text": "The World Bank has since updated its methods, and now measures incomes in 2017 international-$. As part of this change, the International Poverty Line used to measure extreme poverty has also been updated: from $1.90 (in 2011 prices) to $2.15 (in 2017 prices).", "spanType": "span-simple-text"}], "parseErrors": []}, {"type": "text", "value": [{"text": "This has had little effect on our overall understanding of poverty and inequality around the world. But because of the change of units, many of the figures mentioned in this article will differ from the latest World Bank figures.", "spanType": "span-simple-text"}], "parseErrors": []}, {"url": "https://ourworldindata.org/from-1-90-to-2-15-a-day-the-updated-international-poverty-line", "type": "prominent-link", "title": "", "description": "Read more about the World Bank's updated methodology", "parseErrors": []}, {"url": "https://ourworldindata.org/explorers/poverty-explorer", "type": "prominent-link", "title": "Explore the latest World Bank data on poverty and inequality", "description": "", "parseErrors": []}], "type": "article", "title": "World Bank PIP data still in 2011 PPPs warning", "authors": [null], "dateline": "October 17, 2022", "sidebar-toc": false, "featured-image": ""}, "createdAt": "2022-10-17T10:36:56.000Z", "published": false, "updatedAt": "2022-10-17T10:36:56.000Z", "revisionId": null, "publishedAt": "2022-10-17T10:36:56.000Z", "relatedCharts": [], "publicationContext": "listed"} | {"errors": [{"name": "unexpected wp component tag", "details": "Found unhandled wp:comment tag owid/help"}], "numBlocks": 6, "numErrors": 1, "wpTagCounts": {"heading": 1, "owid/help": 1, "paragraph": 5, "owid/prominent-link": 2}, "htmlTagCounts": {"p": 5, "h4": 1}} | 2022-10-17 10:36:56 | 2024-02-16 14:23:03 | [null] | 2022-10-17 10:36:56 | {} | ## The World Bank has updated its poverty and inequality data The data in this article uses a previous release of the World Bank's poverty and inequality data in which incomes are expressed in 2011 international-$. The World Bank has since updated its methods, and now measures incomes in 2017 international-$. As part of this change, the International Poverty Line used to measure extreme poverty has also been updated: from $1.90 (in 2011 prices) to $2.15 (in 2017 prices). This has had little effect on our overall understanding of poverty and inequality around the world. But because of the change of units, many of the figures mentioned in this article will differ from the latest World Bank figures. ### Read more about the World Bank's updated methodology https://ourworldindata.org/from-1-90-to-2-15-a-day-the-updated-international-poverty-line ### Explore the latest World Bank data on poverty and inequality https://ourworldindata.org/explorers/poverty-explorer | {"data": {"wpBlock": {"content": "\t<block type=\"help\">\n\t\t<content>\n\n<h4>The World Bank has updated its poverty and inequality data</h4>\n\n\n\n<p>The data in this article uses a previous release of the World Bank’s poverty and inequality data in which incomes are expressed in 2011 international-$.</p>\n\n\n\n<p>The World Bank has since updated its methods, and now measures incomes in 2017 international-$. As part of this change, the International Poverty Line used to measure extreme poverty has also been updated: from $1.90 (in 2011 prices) to $2.15 (in 2017 prices).</p>\n\n\n\n<p>This has had little effect on our overall understanding of poverty and inequality around the world. But because of the change of units, many of the figures mentioned in this article will differ from the latest World Bank figures.</p>\n\n\n <block type=\"prominent-link\" style=\"is-style-thin\">\n <link-url>https://ourworldindata.org/from-1-90-to-2-15-a-day-the-updated-international-poverty-line</link-url>\n <title></title>\n <content>\n\n<p>Read more about the World Bank’s updated methodology</p>\n\n</content>\n <figure></figure>\n </block>\n\n <block type=\"prominent-link\" style=\"is-style-thin\">\n <link-url>https://ourworldindata.org/explorers/poverty-explorer</link-url>\n <title>Explore the latest World Bank data on poverty and inequality</title>\n <content>\n\n<p></p>\n\n</content>\n <figure></figure>\n </block>\n</content>\n\t</block>"}}, "extensions": {"debug": [{"type": "DEBUG_LOGS_INACTIVE", "message": "GraphQL Debug logging is not active. To see debug logs, GRAPHQL_DEBUG must be enabled."}]}} | ||||
| 1139 | 1139 | 53550 | How many people die from the flu? | influenza-deaths | post | publish | <!-- wp:columns -->
<div class="wp-block-columns"><!-- wp:column -->
<div class="wp-block-column"><!-- wp:paragraph -->
<p>Globally, seasonal influenza kills 400,000 people from respiratory disease each year on average. During large flu pandemics, when influenza strains evolved substantially, the death toll was even higher.</p>
<!-- /wp:paragraph -->
<!-- wp:paragraph -->
<p>But the risk of dying from influenza has declined substantially over time from improvements in sanitation, healthcare, and vaccination. </p>
<!-- /wp:paragraph -->
<!-- wp:paragraph -->
<p>People born in 1940 had around a third of the risk of dying from influenza as those born in 1900 – even when they reached the same age. This decline continued, and those born in 1980 have a risk of half that of those born in 1940.</p>
<!-- /wp:paragraph -->
<!-- wp:paragraph -->
<p>Influenza still remains a large burden around the world, because of an aging population and a lack of access to healthcare and sanitation in many countries. </p>
<!-- /wp:paragraph -->
<!-- wp:paragraph -->
<p>In this article, we look into these developments in detail: how many people die from seasonal influenza and how this has changed over time. </p>
<!-- /wp:paragraph -->
<!-- wp:paragraph -->
<p>We will also look at which factors increase the risk of dying from the flu and understand why, in some years, influenza has led to large pandemics that caused millions of deaths. This knowledge can inform us about the risks of influenza in the future.</p>
<!-- /wp:paragraph --></div>
<!-- /wp:column -->
<!-- wp:column -->
<div class="wp-block-column"></div>
<!-- /wp:column --></div>
<!-- /wp:columns -->
<!-- wp:columns -->
<div class="wp-block-columns"><!-- wp:column -->
<div class="wp-block-column"><!-- wp:heading {"level":4} -->
<h4>How many people die from seasonal influenza?</h4>
<!-- /wp:heading --></div>
<!-- /wp:column -->
<!-- wp:column -->
<div class="wp-block-column"></div>
<!-- /wp:column --></div>
<!-- /wp:columns -->
<!-- wp:columns -->
<div c… |
{"id": "wp-53550", "slug": "influenza-deaths", "content": {"toc": [], "body": [{"type": "text", "value": [{"text": "Globally, seasonal influenza kills 400,000 people from respiratory disease each year on average. During large flu pandemics, when influenza strains evolved substantially, the death toll was even higher.", "spanType": "span-simple-text"}], "parseErrors": []}, {"type": "text", "value": [{"text": "But the risk of dying from influenza has declined substantially over time from improvements in sanitation, healthcare, and vaccination. ", "spanType": "span-simple-text"}], "parseErrors": []}, {"type": "text", "value": [{"text": "People born in 1940 had around a third of the risk of dying from influenza as those born in 1900 – even when they reached the same age. This decline continued, and those born in 1980 have a risk of half that of those born in 1940.", "spanType": "span-simple-text"}], "parseErrors": []}, {"type": "text", "value": [{"text": "Influenza still remains a large burden around the world, because of an aging population and a lack of access to healthcare and sanitation in many countries. ", "spanType": "span-simple-text"}], "parseErrors": []}, {"type": "text", "value": [{"text": "In this article, we look into these developments in detail: how many people die from seasonal influenza and how this has changed over time. ", "spanType": "span-simple-text"}], "parseErrors": []}, {"type": "text", "value": [{"text": "We will also look at which factors increase the risk of dying from the flu and understand why, in some years, influenza has led to large pandemics that caused millions of deaths. This knowledge can inform us about the risks of influenza in the future.", "spanType": "span-simple-text"}], "parseErrors": []}, {"text": [{"text": "How many people die from seasonal influenza?", "spanType": "span-simple-text"}], "type": "heading", "level": 2, "parseErrors": []}, {"left": [{"type": "text", "value": [{"text": "Although this is an important question, it is often difficult to answer.", "spanType": "sp… | {"errors": [{"name": "unexpected wp component tag", "details": "Found unhandled wp:comment tag image"}, {"name": "unexpected wp component tag", "details": "Found unhandled wp:comment tag image"}, {"name": "unexpected wp component tag", "details": "Found unhandled wp:comment tag image"}, {"name": "unexpected wp component tag", "details": "Found unhandled wp:comment tag image"}, {"name": "unhandled html tag found", "details": "Encountered the unhandled tag hr"}, {"name": "unexpected wp component tag", "details": "Found unhandled wp:comment tag separator"}, {"name": "prominent link missing title", "details": "Prominent link is missing a title attribute"}, {"name": "prominent link missing title", "details": "Prominent link is missing a title attribute"}, {"name": "prominent link missing title", "details": "Prominent link is missing a title attribute"}], "numBlocks": 24, "numErrors": 9, "wpTagCounts": {"html": 1, "image": 4, "column": 26, "columns": 13, "heading": 6, "paragraph": 59, "separator": 1, "owid/prominent-link": 3}, "htmlTagCounts": {"p": 59, "h4": 6, "hr": 1, "div": 39, "figure": 4, "iframe": 1}} | 2022-10-20 10:45:00 | 2024-02-16 14:22:54 | 1GhlZrbyAReOwQhdFG9eTsjLXTS_R8YhEK5WvxnM2O9Y | ["Saloni Dattani", "Fiona Spooner"] | The risk of death from influenza has declined over time, but globally, hundreds of thousands of people still die from the disease each year. | 2022-10-17 11:22:54 | 2023-05-17 21:17:28 | https://ourworldindata.org/wp-content/uploads/2022/10/Flu-deaths-thumbnail.png | {} | Globally, seasonal influenza kills 400,000 people from respiratory disease each year on average. During large flu pandemics, when influenza strains evolved substantially, the death toll was even higher. But the risk of dying from influenza has declined substantially over time from improvements in sanitation, healthcare, and vaccination. People born in 1940 had around a third of the risk of dying from influenza as those born in 1900 – even when they reached the same age. This decline continued, and those born in 1980 have a risk of half that of those born in 1940. Influenza still remains a large burden around the world, because of an aging population and a lack of access to healthcare and sanitation in many countries. In this article, we look into these developments in detail: how many people die from seasonal influenza and how this has changed over time. We will also look at which factors increase the risk of dying from the flu and understand why, in some years, influenza has led to large pandemics that caused millions of deaths. This knowledge can inform us about the risks of influenza in the future. ## How many people die from seasonal influenza? Although this is an important question, it is often difficult to answer. Despite being a well-understood disease, it can be hard to count the number of deaths from influenza for several reasons.{ref}Gordon, A., & Reingold, A. (2018). The Burden of Influenza: A Complex Problem. _Current Epidemiology Reports_, _5_(1), 1–9.[ https://doi.org/10.1007/s40471-018-0136-1](https://doi.org/10.1007/s40471-018-0136-1){/ref} One problem is that the symptoms of influenza look similar to other infections, such as respiratory syncytial virus and rhinovirus. In many countries, only a fraction of patients with an "influenza-like illness" are tested to confirm whether they were infected by the virus.{ref}Charbonneau, D. H., & James, L. N. (2019). FluView and FluNet: Tools for Influenza Activity and Surveillance. _Medical Reference Services Quarterly_, _38_(4), 358–368.[ https… | {"id": 53550, "date": "2022-10-20T11:45:00", "guid": {"rendered": "https://owid.cloud/?p=53550"}, "link": "https://owid.cloud/influenza-deaths", "meta": {"owid_publication_context_meta_field": {"latest": true, "homepage": true, "immediate_newsletter": true}}, "slug": "influenza-deaths", "tags": [], "type": "post", "title": {"rendered": "How many people die from the flu?"}, "_links": {"self": [{"href": "https://owid.cloud/wp-json/wp/v2/posts/53550"}], "about": [{"href": "https://owid.cloud/wp-json/wp/v2/types/post"}], "author": [{"href": "https://owid.cloud/wp-json/wp/v2/users/47", "embeddable": true}], "curies": [{"href": "https://api.w.org/{rel}", "name": "wp", "templated": true}], "replies": [{"href": "https://owid.cloud/wp-json/wp/v2/comments?post=53550", "embeddable": true}], "wp:term": [{"href": "https://owid.cloud/wp-json/wp/v2/categories?post=53550", "taxonomy": "category", "embeddable": true}, {"href": "https://owid.cloud/wp-json/wp/v2/tags?post=53550", "taxonomy": "post_tag", "embeddable": true}], "collection": [{"href": "https://owid.cloud/wp-json/wp/v2/posts"}], "wp:attachment": [{"href": "https://owid.cloud/wp-json/wp/v2/media?parent=53550"}], "version-history": [{"href": "https://owid.cloud/wp-json/wp/v2/posts/53550/revisions", "count": 31}], "wp:featuredmedia": [{"href": "https://owid.cloud/wp-json/wp/v2/media/53551", "embeddable": true}], "predecessor-version": [{"id": 57882, "href": "https://owid.cloud/wp-json/wp/v2/posts/53550/revisions/57882"}]}, "author": 47, "format": "standard", "status": "publish", "sticky": false, "content": {"rendered": "\n<div class=\"wp-block-columns\">\n<div class=\"wp-block-column\">\n<p>Globally, seasonal influenza kills 400,000 people from respiratory disease each year on average. During large flu pandemics, when influenza strains evolved substantially, the death toll was even higher.</p>\n\n\n\n<p>But the risk of dying from influenza has declined substantially over time from improvements in sanitation, healthcare, and vaccination. </p>\n\n\n\n<p>People born in … |
| 1138 | 1138 | 53526 | Which countries have put a price on carbon? | carbon-pricing | post | publish | <!-- wp:paragraph --> <p>The true cost of burning fossil fuels is not reflected in their market price. People <a href="https://ourworldindata.org/cheap-renewables-growth">often compare</a> the <em>monetary price</em> of fossil fuels to low-carbon alternatives such as renewables or nuclear energy. But these comparisons do not capture each option’s social impact, even in a purely economic sense.</p> <!-- /wp:paragraph --> <!-- wp:paragraph --> <p>Burning fossil fuels drives <a href="http://ourworldindata.org/climate-change">climate change</a>. The impacts of climate change come at a cost – these impacts are already happening.</p> <!-- /wp:paragraph --> <!-- wp:paragraph --> <p>They also cause local air pollution, which <a href="https://ourworldindata.org/data-review-air-pollution-deaths">kills millions</a> every year and has negative health impacts for many more.</p> <!-- /wp:paragraph --> <!-- wp:paragraph --> <p>One way to address this is to put a price on carbon. The purpose of setting a carbon price is to capture some of these external costs in the market.</p> <!-- /wp:paragraph --> <!-- wp:paragraph --> <p>My colleague, Max Roser, wrote a detailed case for a carbon price <a href="https://ourworldindata.org/carbon-price"><strong>here</strong></a>.</p> <!-- /wp:paragraph --> <!-- wp:paragraph --> <p>Putting a price on carbon achieves a couple of things. First, it makes more polluting fuels, products, and services more expensive. Burning coal becomes <a href="https://ourworldindata.org/safest-sources-of-energy">much more expensive</a> than using solar energy. Beef gets <a href="https://ourworldindata.org/explorers/food-footprints">more expensive</a> relative to tofu or meat alternatives. It makes the ‘cleaner’ option less expensive.</p> <!-- /wp:paragraph --> <!-- wp:paragraph --> <p>Second, it means it’s those who emit greenhouse gases that pay for it.</p> <!-- /wp:paragraph --> <!-- wp:paragraph --> <p>There are a few policies through which countries can put a price on carbon:</p> <!-- /wp:paragraph --> … |
{"id": "wp-53526", "slug": "carbon-pricing", "content": {"toc": [], "body": [{"type": "text", "value": [{"text": "The true cost of burning fossil fuels is not reflected in their market price. People ", "spanType": "span-simple-text"}, {"url": "https://ourworldindata.org/cheap-renewables-growth", "children": [{"text": "often compare", "spanType": "span-simple-text"}], "spanType": "span-link"}, {"text": " the ", "spanType": "span-simple-text"}, {"children": [{"text": "monetary price", "spanType": "span-simple-text"}], "spanType": "span-italic"}, {"text": " of fossil fuels to low-carbon alternatives such as renewables or nuclear energy. But these comparisons do not capture each option’s social impact, even in a purely economic sense.", "spanType": "span-simple-text"}], "parseErrors": []}, {"type": "text", "value": [{"text": "Burning fossil fuels drives ", "spanType": "span-simple-text"}, {"url": "http://ourworldindata.org/climate-change", "children": [{"text": "climate change", "spanType": "span-simple-text"}], "spanType": "span-link"}, {"text": ". The impacts of climate change come at a cost – these impacts are already happening.", "spanType": "span-simple-text"}], "parseErrors": []}, {"type": "text", "value": [{"text": "They also cause local air pollution, which ", "spanType": "span-simple-text"}, {"url": "https://ourworldindata.org/data-review-air-pollution-deaths", "children": [{"text": "kills millions", "spanType": "span-simple-text"}], "spanType": "span-link"}, {"text": " every year and has negative health impacts for many more.", "spanType": "span-simple-text"}], "parseErrors": []}, {"type": "text", "value": [{"text": "One way to address this is to put a price on carbon. The purpose of setting a carbon price is to capture some of these external costs in the market.", "spanType": "span-simple-text"}], "parseErrors": []}, {"type": "text", "value": [{"text": "My colleague, Max Roser, wrote a detailed case for a carbon price ", "spanType": "span-simple-text"}, {"url": "https://ourworldindata.org/carbon-price", "c… | {"errors": [{"name": "unexpected wp component tag", "details": "Found unhandled wp:comment tag list"}], "numBlocks": 31, "numErrors": 1, "wpTagCounts": {"html": 6, "list": 1, "column": 12, "columns": 6, "heading": 7, "paragraph": 28, "owid/prominent-link": 3}, "htmlTagCounts": {"p": 28, "h3": 3, "h4": 2, "h5": 2, "ul": 1, "div": 18, "iframe": 6}} | 2022-10-14 10:00:00 | 2024-02-16 14:22:54 | 1a7detrKx0jOujqXN9k0pj0wPiE-NnbC4r7xAUeimgiA | ["Hannah Ritchie", "Pablo Rosado"] | Putting a price on carbon helps us account for the real costs of fossil fuels in the market. Which countries have a carbon tax or trading system? | 2022-10-11 10:22:07 | 2022-10-14 11:06:38 | https://ourworldindata.org/wp-content/uploads/2022/10/Carbon-taxes-featured-image.png | {} | The true cost of burning fossil fuels is not reflected in their market price. People [often compare](https://ourworldindata.org/cheap-renewables-growth) the _monetary price_ of fossil fuels to low-carbon alternatives such as renewables or nuclear energy. But these comparisons do not capture each option’s social impact, even in a purely economic sense. Burning fossil fuels drives [climate change](http://ourworldindata.org/climate-change). The impacts of climate change come at a cost – these impacts are already happening. They also cause local air pollution, which [kills millions](https://ourworldindata.org/data-review-air-pollution-deaths) every year and has negative health impacts for many more. One way to address this is to put a price on carbon. The purpose of setting a carbon price is to capture some of these external costs in the market. My colleague, Max Roser, wrote a detailed case for a carbon price [**here**](https://ourworldindata.org/carbon-price). Putting a price on carbon achieves a couple of things. First, it makes more polluting fuels, products, and services more expensive. Burning coal becomes [much more expensive](https://ourworldindata.org/safest-sources-of-energy) than using solar energy. Beef gets [more expensive](https://ourworldindata.org/explorers/food-footprints) relative to tofu or meat alternatives. It makes the ‘cleaner’ option less expensive. Second, it means it’s those who emit greenhouse gases that pay for it. There are a few policies through which countries can put a price on carbon: * **Carbon tax: **this is a levy that is applied to the production of greenhouse gas emissions directly or fuels that emit these gases when they’re burned. This means goods and services which emit more greenhouse gases in their production will have a higher tax. * **Emissions trading system: **this is sometimes called a ‘cap and trade’ system. Here, the carbon price changes over time. A maximum level of pollution (a ‘cap’) is defined and manufacturers need licenses to emit greenhouse gases. How e… | {"id": 53526, "date": "2022-10-14T11:00:00", "guid": {"rendered": "https://owid.cloud/?p=53526"}, "link": "https://owid.cloud/carbon-pricing", "meta": {"owid_publication_context_meta_field": {"latest": true, "homepage": true, "immediate_newsletter": true}}, "slug": "carbon-pricing", "tags": [], "type": "post", "title": {"rendered": "Which countries have put a price on carbon?"}, "_links": {"self": [{"href": "https://owid.cloud/wp-json/wp/v2/posts/53526"}], "about": [{"href": "https://owid.cloud/wp-json/wp/v2/types/post"}], "author": [{"href": "https://owid.cloud/wp-json/wp/v2/users/17", "embeddable": true}], "curies": [{"href": "https://api.w.org/{rel}", "name": "wp", "templated": true}], "replies": [{"href": "https://owid.cloud/wp-json/wp/v2/comments?post=53526", "embeddable": true}], "wp:term": [{"href": "https://owid.cloud/wp-json/wp/v2/categories?post=53526", "taxonomy": "category", "embeddable": true}, {"href": "https://owid.cloud/wp-json/wp/v2/tags?post=53526", "taxonomy": "post_tag", "embeddable": true}], "collection": [{"href": "https://owid.cloud/wp-json/wp/v2/posts"}], "wp:attachment": [{"href": "https://owid.cloud/wp-json/wp/v2/media?parent=53526"}], "version-history": [{"href": "https://owid.cloud/wp-json/wp/v2/posts/53526/revisions", "count": 12}], "wp:featuredmedia": [{"href": "https://owid.cloud/wp-json/wp/v2/media/53529", "embeddable": true}], "predecessor-version": [{"id": 53664, "href": "https://owid.cloud/wp-json/wp/v2/posts/53526/revisions/53664"}]}, "author": 17, "format": "standard", "status": "publish", "sticky": false, "content": {"rendered": "\n<p>The true cost of burning fossil fuels is not reflected in their market price. People <a href=\"https://ourworldindata.org/cheap-renewables-growth\">often compare</a> the <em>monetary price</em> of fossil fuels to low-carbon alternatives such as renewables or nuclear energy. But these comparisons do not capture each option’s social impact, even in a purely economic sense.</p>\n\n\n\n<p>Burning fossil fuels drives <a href=\"http://ourworldindata.o… |
| 1134 | 1134 | 53401 | Ocean plastics: How much do rich countries contribute by shipping their waste overseas? | plastic-waste-trade | post | publish | <!-- wp:paragraph -->
<p>Most of the plastic that enters the oceans from land <a href="https://ourworldindata.org/ocean-plastics">comes from</a> rivers in Asia.{ref}It’s estimated that around 70% to 80% of the plastic in the ocean comes from land. The other 20% to 30% comes from marine sources, such as fishing nets and lines.<br><br>In some parts of the ocean, the contribution of marine sources is higher. For example, it’s estimated that up to 52% of the plastic mass in the ‘Great Pacific Garbage Patch’ is plastic lines, ropes, and fishing nets.<br><br>Li, W. C., Tse, H. F., & Fok, L. (2016). <a href="https://www.sciencedirect.com/science/article/pii/S0048969716310154">Plastic waste in the marine environment: A review of sources, occurrence and effects</a>. <em>Science of the Total Environment</em>, 566, 333-349.</p>
<!-- /wp:paragraph -->
<!-- wp:paragraph -->
<p>Lebreton, L., Slat, B., Ferrari, F., Sainte-Rose, B., Aitken, J., Marthouse, R., … & Noble, K. (2018). <a href="https://www.nature.com/articles/s41598-018-22939-w">Evidence that the Great Pacific Garbage Patch is rapidly accumulating plastic</a>. <em>Scientific Reports</em>, 8(1), 4666.{/ref} More than 80% of it.{ref}One of the most recent estimates from Meijer et al. (2021) estimates that 81% of plastic waste that is emitted to the ocean comes from Asia.</p>
<!-- /wp:paragraph -->
<!-- wp:paragraph -->
<p>An earlier study, by Lebreton et al. (2017), estimated a similar figure of 86% coming from Asian rivers.</p>
<!-- /wp:paragraph -->
<!-- wp:paragraph -->
<p>Meijer, J.J.L, Emmerik, T., Ent, R., Schmidt, C., Lebreton, L. (2021). <a href="https://advances.sciencemag.org/content/7/18/eaaz5803">More than 1000 rivers account for 80% of global riverine plastic emissions into the ocean</a>. <em>Science Advances</em>.</p>
<!-- /wp:paragraph -->
<!-- wp:paragraph -->
<p>Lebreton, L. C., Van der Zwet, J., Damsteeg, J. W., Slat, B., Andrady, A., & Reisser, J. (2017). <a href="https://www.nature.com/articles/ncomms15611">River plastic emissions to… |
{"id": "wp-53401", "slug": "plastic-waste-trade", "content": {"toc": [], "body": [{"type": "text", "value": [{"text": "Most of the plastic that enters the oceans from land ", "spanType": "span-simple-text"}, {"url": "https://ourworldindata.org/ocean-plastics", "children": [{"text": "comes from", "spanType": "span-simple-text"}], "spanType": "span-link"}, {"text": " rivers in Asia.{ref}It’s estimated that around 70% to 80% of the plastic in the ocean comes from land. The other 20% to 30% comes from marine sources, such as fishing nets and lines.", "spanType": "span-simple-text"}, {"spanType": "span-newline"}, {"spanType": "span-newline"}, {"text": "In some parts of the ocean, the contribution of marine sources is higher. For example, it’s estimated that up to 52% of the plastic mass in the ‘Great Pacific Garbage Patch’ is plastic lines, ropes, and fishing nets.", "spanType": "span-simple-text"}, {"spanType": "span-newline"}, {"spanType": "span-newline"}, {"text": "Li, W. C., Tse, H. F., & Fok, L. (2016). ", "spanType": "span-simple-text"}, {"url": "https://www.sciencedirect.com/science/article/pii/S0048969716310154", "children": [{"text": "Plastic waste in the marine environment: A review of sources, occurrence and effects", "spanType": "span-simple-text"}], "spanType": "span-link"}, {"text": ". ", "spanType": "span-simple-text"}, {"children": [{"text": "Science of the Total Environment", "spanType": "span-simple-text"}], "spanType": "span-italic"}, {"text": ", 566, 333-349.", "spanType": "span-simple-text"}], "parseErrors": []}, {"type": "text", "value": [{"text": "Lebreton, L., Slat, B., Ferrari, F., Sainte-Rose, B., Aitken, J., Marthouse, R., … & Noble, K. (2018). ", "spanType": "span-simple-text"}, {"url": "https://www.nature.com/articles/s41598-018-22939-w", "children": [{"text": "Evidence that the Great Pacific Garbage Patch is rapidly accumulating plastic", "spanType": "span-simple-text"}], "spanType": "span-link"}, {"text": ". ", "spanType": "span-simple-text"}, {"children": [{"text": "Scientific Reports",… | {"errors": [{"name": "unexpected wp component tag", "details": "Found unhandled wp:comment tag image"}, {"name": "unhandled html tag found", "details": "Encountered the unhandled tag hr"}, {"name": "unexpected wp component tag", "details": "Found unhandled wp:comment tag separator"}], "numBlocks": 55, "numErrors": 3, "wpTagCounts": {"html": 4, "image": 1, "column": 14, "columns": 7, "heading": 8, "paragraph": 59, "separator": 1, "owid/prominent-link": 3}, "htmlTagCounts": {"p": 59, "h3": 5, "h4": 1, "h5": 2, "hr": 1, "div": 21, "figure": 1, "iframe": 4}} | 2022-10-11 09:50:00 | 2024-02-16 14:22:54 | 1Zz6fB2VxqBBtsSSDN8grd8AhfLRjNHfhU43ksS2Qk-0 | ["Hannah Ritchie"] | Many countries ship plastic waste overseas. How much of the world’s waste is traded, and how big is its role in the pollution of our oceans? | 2022-10-06 10:50:21 | 2022-10-25 12:06:49 | https://ourworldindata.org/wp-content/uploads/2022/10/Plastic-waste-trade-featured-image.png | {} | Most of the plastic that enters the oceans from land [comes from](https://ourworldindata.org/ocean-plastics) rivers in Asia.{ref}It’s estimated that around 70% to 80% of the plastic in the ocean comes from land. The other 20% to 30% comes from marine sources, such as fishing nets and lines. In some parts of the ocean, the contribution of marine sources is higher. For example, it’s estimated that up to 52% of the plastic mass in the ‘Great Pacific Garbage Patch’ is plastic lines, ropes, and fishing nets. Li, W. C., Tse, H. F., & Fok, L. (2016). [Plastic waste in the marine environment: A review of sources, occurrence and effects](https://www.sciencedirect.com/science/article/pii/S0048969716310154). _Science of the Total Environment_, 566, 333-349. Lebreton, L., Slat, B., Ferrari, F., Sainte-Rose, B., Aitken, J., Marthouse, R., … & Noble, K. (2018). [Evidence that the Great Pacific Garbage Patch is rapidly accumulating plastic](https://www.nature.com/articles/s41598-018-22939-w). _Scientific Reports_, 8(1), 4666.{/ref} More than 80% of it.{ref}One of the most recent estimates from Meijer et al. (2021) estimates that 81% of plastic waste that is emitted to the ocean comes from Asia. An earlier study, by Lebreton et al. (2017), estimated a similar figure of 86% coming from Asian rivers. Meijer, J.J.L, Emmerik, T., Ent, R., Schmidt, C., Lebreton, L. (2021). [More than 1000 rivers account for 80% of global riverine plastic emissions into the ocean](https://advances.sciencemag.org/content/7/18/eaaz5803). _Science Advances_. Lebreton, L. C., Van der Zwet, J., Damsteeg, J. W., Slat, B., Andrady, A., & Reisser, J. (2017). [River plastic emissions to the world’s oceans](https://www.nature.com/articles/ncomms15611). _Nature Communications_, 8, 15611.{/ref} Only a small amount comes from rivers across Europe and North America. Together, [rivers in these regions contribute](https://ourworldindata.org/grapher/share-of-global-plastic-waste-emitted-to-the-ocean?tab=chart&country=Africa~Asia~Europe~South+America~Nor… | {"id": 53401, "date": "2022-10-11T10:50:00", "guid": {"rendered": "https://owid.cloud/?p=53401"}, "link": "https://owid.cloud/plastic-waste-trade", "meta": {"owid_publication_context_meta_field": {"latest": true, "homepage": true, "immediate_newsletter": true}}, "slug": "plastic-waste-trade", "tags": [], "type": "post", "title": {"rendered": "Ocean plastics: How much do rich countries contribute by shipping their waste overseas?"}, "_links": {"self": [{"href": "https://owid.cloud/wp-json/wp/v2/posts/53401"}], "about": [{"href": "https://owid.cloud/wp-json/wp/v2/types/post"}], "author": [{"href": "https://owid.cloud/wp-json/wp/v2/users/17", "embeddable": true}], "curies": [{"href": "https://api.w.org/{rel}", "name": "wp", "templated": true}], "replies": [{"href": "https://owid.cloud/wp-json/wp/v2/comments?post=53401", "embeddable": true}], "wp:term": [{"href": "https://owid.cloud/wp-json/wp/v2/categories?post=53401", "taxonomy": "category", "embeddable": true}, {"href": "https://owid.cloud/wp-json/wp/v2/tags?post=53401", "taxonomy": "post_tag", "embeddable": true}], "collection": [{"href": "https://owid.cloud/wp-json/wp/v2/posts"}], "wp:attachment": [{"href": "https://owid.cloud/wp-json/wp/v2/media?parent=53401"}], "version-history": [{"href": "https://owid.cloud/wp-json/wp/v2/posts/53401/revisions", "count": 16}], "wp:featuredmedia": [{"href": "https://owid.cloud/wp-json/wp/v2/media/53420", "embeddable": true}], "predecessor-version": [{"id": 54072, "href": "https://owid.cloud/wp-json/wp/v2/posts/53401/revisions/54072"}]}, "author": 17, "format": "standard", "status": "publish", "sticky": false, "content": {"rendered": "\n<p>Most of the plastic that enters the oceans from land <a href=\"https://ourworldindata.org/ocean-plastics\">comes from</a> rivers in Asia.{ref}It’s estimated that around 70% to 80% of the plastic in the ocean comes from land. The other 20% to 30% comes from marine sources, such as fishing nets and lines.<br><br>In some parts of the ocean, the contribution of marine sources is higher. For examp… |
| 1133 | 1133 | 53245 | From $1.90 to $2.15 a day: the updated International Poverty Line | from-1-90-to-2-15-a-day-the-updated-international-poverty-line | post | publish | <!-- wp:paragraph -->
<p>To track progress towards its goal of <a href="https://sdg-tracker.org/no-poverty#1.1">eradicating extreme poverty by 2030</a>, the UN relies on World Bank estimates of the share of the world population that fall below the International Poverty Line.</p>
<!-- /wp:paragraph -->
<!-- wp:paragraph -->
<p>In September 2022, the figure at which this poverty line is set shifted from $1.90 to $2.15. This reflects a change in the units in which the World Bank expresses its poverty and inequality data – from international dollars given in <em>2011</em> prices to international dollars given in <em>2017</em> prices.</p>
<!-- /wp:paragraph -->
<!-- wp:paragraph -->
<p>In this article we consider what the World Bank’s revised methodology means for our understanding of global poverty. We then also explain the updated methodology: what international dollars are, what the change to 2017 prices mean, and how this change affects the International Poverty Line and the World Bank’s poverty estimates.</p>
<!-- /wp:paragraph -->
<!-- wp:heading {"level":3} -->
<h3><strong>How does the updated International Poverty Line affect our understanding of global poverty?</strong></h3>
<!-- /wp:heading -->
<!-- wp:paragraph -->
<p>The crucial fact to know about the World Bank’s updated International Poverty Line is that, whilst the number has risen – from $1.90 to $2.15 per day – in terms of the goods and services that it affords, the value is broadly the same.</p>
<!-- /wp:paragraph -->
<!-- wp:paragraph -->
<p>This is because the units in which the old and new figures are counted have changed: the $1.90 figure was expressed in 2011 international-$, and the new figure of $2.15 is expressed in 2017 international-$.</p>
<!-- /wp:paragraph -->
<!-- wp:paragraph -->
<p>Below we explain in much more detail what international dollars are and what the change in base year means. But broadly speaking, the difference in the two units reflects inflation over time: Because prices have gone up, one 2017 international-$ buys a… |
{"id": "wp-53245", "slug": "from-1-90-to-2-15-a-day-the-updated-international-poverty-line", "content": {"toc": [], "body": [{"type": "text", "value": [{"text": "To track progress towards its goal of ", "spanType": "span-simple-text"}, {"url": "https://sdg-tracker.org/no-poverty#1.1", "children": [{"text": "eradicating extreme poverty by 2030", "spanType": "span-simple-text"}], "spanType": "span-link"}, {"text": ", the UN relies on World Bank estimates of the share of the world population that fall below the International Poverty Line.", "spanType": "span-simple-text"}], "parseErrors": []}, {"type": "text", "value": [{"text": "In September 2022, the figure at which this poverty line is set shifted from $1.90 to $2.15. This reflects a change in the units in which the World Bank expresses its poverty and inequality data – from international dollars given in ", "spanType": "span-simple-text"}, {"children": [{"text": "2011", "spanType": "span-simple-text"}], "spanType": "span-italic"}, {"text": " prices to international dollars given in ", "spanType": "span-simple-text"}, {"children": [{"text": "2017", "spanType": "span-simple-text"}], "spanType": "span-italic"}, {"text": " prices.", "spanType": "span-simple-text"}], "parseErrors": []}, {"type": "text", "value": [{"text": "In this article we consider what the World Bank’s revised methodology means for our understanding of global poverty. We then also explain the updated methodology: what international dollars are, what the change to 2017 prices mean, and how this change affects the International Poverty Line and the World Bank’s poverty estimates.", "spanType": "span-simple-text"}], "parseErrors": []}, {"text": [{"children": [{"text": "How does the updated International Poverty Line affect our understanding of global poverty?", "spanType": "span-simple-text"}], "spanType": "span-bold"}], "type": "heading", "level": 2, "parseErrors": []}, {"type": "text", "value": [{"text": "The crucial fact to know about the World Bank’s updated International Poverty Line is that, wh… | {"errors": [{"name": "unexpected wp component tag", "details": "Found unhandled wp:comment tag list"}, {"name": "unexpected wp component tag", "details": "Found unhandled wp:comment tag list"}, {"name": "unexpected wp component tag", "details": "Found unhandled wp:comment tag list"}], "numBlocks": 77, "numErrors": 3, "wpTagCounts": {"html": 10, "list": 3, "image": 1, "column": 11, "columns": 6, "heading": 15, "paragraph": 87, "owid/additional-information": 2}, "htmlTagCounts": {"p": 87, "h3": 8, "h4": 7, "ul": 3, "div": 17, "figure": 1, "iframe": 10}} | 2022-10-26 12:00:00 | 2024-02-23 00:31:15 | 1i4_3CJJPt9VgVx9JrPtApCCVIqV6kV2Y_Awk4CvEpnw | ["Joe Hasell"] | The World Bank has updated the methods it uses to measure incomes and poverty around the world. What does this mean for our understanding of global poverty? | 2022-10-17 06:35:09 | 2023-06-30 12:50:33 | https://ourworldindata.org/wp-content/uploads/2022/10/Poverty-line-thumbnail.png | {} | {"id": 53245, "date": "2022-10-26T13:00:00", "guid": {"rendered": "https://owid.cloud/?p=53245"}, "link": "https://owid.cloud/from-1-90-to-2-15-a-day-the-updated-international-poverty-line", "meta": {"owid_publication_context_meta_field": {"latest": true, "homepage": true, "immediate_newsletter": true}}, "slug": "from-1-90-to-2-15-a-day-the-updated-international-poverty-line", "tags": [], "type": "post", "title": {"rendered": "From $1.90 to $2.15 a day: the updated International Poverty Line"}, "_links": {"self": [{"href": "https://owid.cloud/wp-json/wp/v2/posts/53245"}], "about": [{"href": "https://owid.cloud/wp-json/wp/v2/types/post"}], "author": [{"href": "https://owid.cloud/wp-json/wp/v2/users/14", "embeddable": true}], "curies": [{"href": "https://api.w.org/{rel}", "name": "wp", "templated": true}], "replies": [{"href": "https://owid.cloud/wp-json/wp/v2/comments?post=53245", "embeddable": true}], "wp:term": [{"href": "https://owid.cloud/wp-json/wp/v2/categories?post=53245", "taxonomy": "category", "embeddable": true}, {"href": "https://owid.cloud/wp-json/wp/v2/tags?post=53245", "taxonomy": "post_tag", "embeddable": true}], "collection": [{"href": "https://owid.cloud/wp-json/wp/v2/posts"}], "wp:attachment": [{"href": "https://owid.cloud/wp-json/wp/v2/media?parent=53245"}], "version-history": [{"href": "https://owid.cloud/wp-json/wp/v2/posts/53245/revisions", "count": 29}], "wp:featuredmedia": [{"href": "https://owid.cloud/wp-json/wp/v2/media/53729", "embeddable": true}], "predecessor-version": [{"id": 57676, "href": "https://owid.cloud/wp-json/wp/v2/posts/53245/revisions/57676"}]}, "author": 14, "format": "standard", "status": "publish", "sticky": false, "content": {"rendered": "\n<p>To track progress towards its goal of <a href=\"https://sdg-tracker.org/no-poverty#1.1\">eradicating extreme poverty by 2030</a>, the UN relies on World Bank estimates of the share of the world population that fall below the International Poverty Line.</p>\n\n\n\n<p>In September 2022, the figure at which this poverty line is set … | |
| 1130 | 1130 | 53117 | Ike reusable block test | ike-reusable-block-test | wp_block | publish | <!-- wp:group --> <div class="wp-block-group"><!-- wp:paragraph --> <p>How do reusable blocks work?</p> <!-- /wp:paragraph --> <!-- wp:paragraph --> <p>I don't know</p> <!-- /wp:paragraph --></div> <!-- /wp:group --> |
{"id": "wp-53117", "slug": "ike-reusable-block-test", "content": {"toc": [], "body": [{"type": "text", "value": [{"text": "How do reusable blocks work?", "spanType": "span-simple-text"}], "parseErrors": []}, {"type": "text", "value": [{"text": "I don't know", "spanType": "span-simple-text"}], "parseErrors": []}], "type": "article", "title": "Ike reusable block test", "authors": [null], "dateline": "September 22, 2022", "sidebar-toc": false, "featured-image": ""}, "createdAt": "2022-09-22T17:44:24.000Z", "published": false, "updatedAt": "2022-09-22T17:44:24.000Z", "revisionId": null, "publishedAt": "2022-09-22T17:44:24.000Z", "relatedCharts": [], "publicationContext": "listed"} | {"errors": [{"name": "unexpected wp component tag", "details": "Found unhandled wp:comment tag group"}], "numBlocks": 2, "numErrors": 1, "wpTagCounts": {"group": 1, "paragraph": 2}, "htmlTagCounts": {"p": 2, "div": 1}} | 2022-09-22 17:44:24 | 2024-03-05 09:19:24 | [null] | 2022-09-22 17:44:24 | {} | How do reusable blocks work? I don't know | {"data": {"wpBlock": {"content": "\n<div class=\"wp-container-65e6e37975069 wp-block-group\">\n<p>How do reusable blocks work?</p>\n\n\n\n<p>I don’t know</p>\n</div>\n"}}, "extensions": {"debug": [{"type": "DEBUG_LOGS_INACTIVE", "message": "GraphQL Debug logging is not active. To see debug logs, GRAPHQL_DEBUG must be enabled."}]}} | ||||
| 1127 | 1127 | 52784 | What do poor people think about poverty? | what-do-poor-people-think-about-poverty | post | publish | <!-- wp:html -->
<div class="blog-info">
<p>Our World in Data presents the data and research to make progress against the world’s largest problems.<br>Find all our data and research on poverty on our <strong><a href="https://ourworldindata.org/poverty" target="_blank" rel="noopener">Poverty</a></strong> topic page.
</div>
<!-- /wp:html -->
<!-- wp:paragraph -->
<p>One of the most important trends that we can learn from the work of social scientists and historians is that extreme poverty, as measured by people's level of consumption, has fallen considerably around the world in the <a href="https://ourworldindata.org/grapher/share-in-poverty-relative-to-different-poverty-thresholds-historical?country=~OWID_WRL">last two centuries</a>. But why should we care? Is it not the case that poor people might have less consumption but enjoy their lives just as much—or even more—than people with much higher consumption levels?</p>
<!-- /wp:paragraph -->
<!-- wp:paragraph -->
<p>One way to find out is to simply ask. Subjective views are an important way of measuring welfare.</p>
<!-- /wp:paragraph -->
<!-- wp:paragraph -->
<p>This is what the <em>Gallup Organization</em> did. The <a href="https://www.gallup.com/analytics/232838/world-poll.aspx" target="_blank" rel="noreferrer noopener">Gallup World Poll</a> asked people around the world what they thought about their standard of living—not only about their income. The following chart compares the answers of people in different countries with the average income in those countries. It shows that, broadly speaking, people living in poorer countries tend to be less satisfied with their living standards.</p>
<!-- /wp:paragraph -->
<!-- wp:heading {"level":6} -->
<h6>Dissatisfaction with standard of living vs GDP per capita{ref} GDP per capita data from the World Bank. Survey data on the satisfaction with living standards is from the <a href="http://www.gallup.com/services/170945/world-poll.aspx">Gallup World Poll</a>. The idea for this chart is taken from Deaton (2010)… |
{"id": "wp-52784", "slug": "what-do-poor-people-think-about-poverty", "content": {"toc": [], "body": [{"type": "text", "value": [{"text": "Our World in Data presents the data and research to make progress against the world’s largest problems.", "spanType": "span-simple-text"}, {"spanType": "span-newline"}, {"text": "Find all our data and research on poverty on our ", "spanType": "span-simple-text"}, {"children": [{"url": "https://ourworldindata.org/poverty", "children": [{"text": "Poverty", "spanType": "span-simple-text"}], "spanType": "span-link"}], "spanType": "span-bold"}, {"text": " topic page.\n", "spanType": "span-simple-text"}], "parseErrors": []}, {"type": "text", "value": [{"text": "One of the most important trends that we can learn from the work of social scientists and historians is that extreme poverty, as measured by people's level of consumption, has fallen considerably around the world in the ", "spanType": "span-simple-text"}, {"url": "https://ourworldindata.org/grapher/share-in-poverty-relative-to-different-poverty-thresholds-historical?country=~OWID_WRL", "children": [{"text": "last two centuries", "spanType": "span-simple-text"}], "spanType": "span-link"}, {"text": ". But why should we care? Is it not the case that poor people might have less consumption but enjoy their lives just as much—or even more—than people with much higher consumption levels?", "spanType": "span-simple-text"}], "parseErrors": []}, {"type": "text", "value": [{"text": "One way to find out is to simply ask. Subjective views are an important way of measuring welfare.", "spanType": "span-simple-text"}], "parseErrors": []}, {"type": "text", "value": [{"text": "This is what the ", "spanType": "span-simple-text"}, {"children": [{"text": "Gallup Organization", "spanType": "span-simple-text"}], "spanType": "span-italic"}, {"text": " did. The ", "spanType": "span-simple-text"}, {"url": "https://www.gallup.com/analytics/232838/world-poll.aspx", "children": [{"text": "Gallup World Poll", "spanType": "span-simple-text"}], "spanType": … | {"errors": [{"name": "unexpected wp component tag", "details": "Found unhandled wp:comment tag image"}], "numBlocks": 12, "numErrors": 1, "wpTagCounts": {"html": 1, "image": 1, "heading": 1, "paragraph": 9}, "htmlTagCounts": {"p": 10, "h6": 1, "div": 2, "figure": 1}} | 2017-04-08 09:15:00 | 2024-02-16 14:22:46 | 1RdWJsqh16BxYqHLloK8RHnbuVYgVX2eHOlDodo9wIGk | ["Max Roser"] | Some have a romantic view of what life on an extremely low income must be like. But we see from survey data that this is romantic view is not shared by those living in poverty themselves. | 2022-09-08 10:15:41 | 2022-09-08 09:55:07 | https://ourworldindata.org/wp-content/uploads/2017/01/dissatisfied-vs-income.png | {} | Our World in Data presents the data and research to make progress against the world’s largest problems. Find all our data and research on poverty on our **[Poverty](https://ourworldindata.org/poverty)** topic page. One of the most important trends that we can learn from the work of social scientists and historians is that extreme poverty, as measured by people's level of consumption, has fallen considerably around the world in the [last two centuries](https://ourworldindata.org/grapher/share-in-poverty-relative-to-different-poverty-thresholds-historical?country=~OWID_WRL). But why should we care? Is it not the case that poor people might have less consumption but enjoy their lives just as much—or even more—than people with much higher consumption levels? One way to find out is to simply ask. Subjective views are an important way of measuring welfare. This is what the _Gallup Organization_ did. The [Gallup World Poll](https://www.gallup.com/analytics/232838/world-poll.aspx) asked people around the world what they thought about their standard of living—not only about their income. The following chart compares the answers of people in different countries with the average income in those countries. It shows that, broadly speaking, people living in poorer countries tend to be less satisfied with their living standards. ## Dissatisfaction with standard of living vs GDP per capita{ref} GDP per capita data from the World Bank. Survey data on the satisfaction with living standards is from the [Gallup World Poll](http://www.gallup.com/services/170945/world-poll.aspx). The idea for this chart is taken from Deaton (2010) – [Price Indexes, Inequality, and the Measurement of World Poverty](https://rpds.princeton.edu/sites/rpds/files/media/deaton_price_indexes_inequality_and_the_measurement_of_world_poverty_aer.pdf). In American Economic Review, 100, 1, 5--34. The lightly-shaded circles are for 2006, the darker circles for 2007, and the darkest circles are for 2008.{/ref} <Image filename="dissatisfied-vs-income.png" alt… | {"id": 52784, "date": "2017-04-08T10:15:00", "guid": {"rendered": "https://owid.cloud/?p=52784"}, "link": "https://owid.cloud/what-do-poor-people-think-about-poverty", "meta": {"owid_publication_context_meta_field": []}, "slug": "what-do-poor-people-think-about-poverty", "tags": [132], "type": "post", "title": {"rendered": "What do poor people think about poverty?"}, "_links": {"self": [{"href": "https://owid.cloud/wp-json/wp/v2/posts/52784"}], "about": [{"href": "https://owid.cloud/wp-json/wp/v2/types/post"}], "author": [{"href": "https://owid.cloud/wp-json/wp/v2/users/2", "embeddable": true}], "curies": [{"href": "https://api.w.org/{rel}", "name": "wp", "templated": true}], "replies": [{"href": "https://owid.cloud/wp-json/wp/v2/comments?post=52784", "embeddable": true}], "wp:term": [{"href": "https://owid.cloud/wp-json/wp/v2/categories?post=52784", "taxonomy": "category", "embeddable": true}, {"href": "https://owid.cloud/wp-json/wp/v2/tags?post=52784", "taxonomy": "post_tag", "embeddable": true}], "collection": [{"href": "https://owid.cloud/wp-json/wp/v2/posts"}], "wp:attachment": [{"href": "https://owid.cloud/wp-json/wp/v2/media?parent=52784"}], "version-history": [{"href": "https://owid.cloud/wp-json/wp/v2/posts/52784/revisions", "count": 2}], "wp:featuredmedia": [{"href": "https://owid.cloud/wp-json/wp/v2/media/10844", "embeddable": true}], "predecessor-version": [{"id": 52786, "href": "https://owid.cloud/wp-json/wp/v2/posts/52784/revisions/52786"}]}, "author": 2, "format": "standard", "status": "publish", "sticky": false, "content": {"rendered": "\n<div class=\"blog-info\">\n<p>Our World in Data presents the data and research to make progress against the world’s largest problems.<br>Find all our data and research on poverty on our <strong><a href=\"https://ourworldindata.org/poverty\" target=\"_blank\" rel=\"noopener\">Poverty</a></strong> topic page.\n</div>\n\n\n\n<p>One of the most important trends that we can learn from the work of social scientists and historians is that extreme poverty, as measured by… |
| 1124 | 1124 | 52633 | About PIP data explorer block | about-pip-data-explorer-block | wp_block | publish | <!-- wp:paragraph -->
<p>All the data included in this explorer is available to download <a href="https://github.com/owid/poverty-data">in GitHub</a>, alongside a range of other poverty and inequality metrics.</p>
<!-- /wp:paragraph -->
<!-- wp:heading {"level":3} -->
<h3>About this data</h3>
<!-- /wp:heading -->
<!-- wp:heading {"level":4} -->
<h4>Where is this data sourced from?</h4>
<!-- /wp:heading -->
<!-- wp:paragraph -->
<p>This data explorer is collated and adapted from the World Bank’s <a href="https://pip.worldbank.org/home">Poverty and Inequality Platform</a> (PIP).</p>
<!-- /wp:paragraph -->
<!-- wp:paragraph -->
<p>The World Bank’s PIP data is a large collection of household surveys where steps have been taken by the World Bank to harmonize definitions and methods across countries and over time.</p>
<!-- /wp:paragraph -->
<!-- wp:heading {"level":4} -->
<h4>About the comparability of household surveys</h4>
<!-- /wp:heading -->
<!-- wp:paragraph -->
<p>There is no global survey of incomes. To understand how incomes across the world compare, researchers need to rely on available national surveys.</p>
<!-- /wp:paragraph -->
<!-- wp:paragraph -->
<p>Such surveys are partly designed with cross-country comparability in mind, but because the surveys reflect the circumstances and priorities of individual countries at the time of the survey, there are some important differences.</p>
<!-- /wp:paragraph -->
<!-- wp:paragraph -->
<p><strong>Income vs expenditure surveys</strong></p>
<!-- /wp:paragraph -->
<!-- wp:paragraph -->
<p>One important issue is that the survey data included within the <a href="https://pip.worldbank.org/home">PIP</a> database tends to measure people’s income in high-income countries, and people’s consumption expenditure in poorer countries.</p>
<!-- /wp:paragraph -->
<!-- wp:paragraph -->
<p>The two concepts are closely related: the income of a household equals their consumption plus any saving, or minus any borrowing or spending out of savings. </p>
<!-- /wp:paragraph -->
… |
{"id": "wp-52633", "slug": "about-pip-data-explorer-block", "content": {"toc": [], "body": [{"type": "text", "value": [{"text": "All the data included in this explorer is available to download ", "spanType": "span-simple-text"}, {"url": "https://github.com/owid/poverty-data", "children": [{"text": "in GitHub", "spanType": "span-simple-text"}], "spanType": "span-link"}, {"text": ", alongside a range of other poverty and inequality metrics.", "spanType": "span-simple-text"}], "parseErrors": []}, {"text": [{"text": "About this data", "spanType": "span-simple-text"}], "type": "heading", "level": 2, "parseErrors": []}, {"text": [{"text": "Where is this data sourced from?", "spanType": "span-simple-text"}], "type": "heading", "level": 3, "parseErrors": []}, {"type": "text", "value": [{"text": "This data explorer is collated and adapted from the World Bank’s ", "spanType": "span-simple-text"}, {"url": "https://pip.worldbank.org/home", "children": [{"text": "Poverty and Inequality Platform", "spanType": "span-simple-text"}], "spanType": "span-link"}, {"text": " (PIP).", "spanType": "span-simple-text"}], "parseErrors": []}, {"type": "text", "value": [{"text": "The World Bank’s PIP data is a large collection of household surveys where steps have been taken by the World Bank to harmonize definitions and methods across countries and over time.", "spanType": "span-simple-text"}], "parseErrors": []}, {"text": [{"text": "About the comparability of household surveys", "spanType": "span-simple-text"}], "type": "heading", "level": 3, "parseErrors": []}, {"type": "text", "value": [{"text": "There is no global survey of incomes. To understand how incomes across the world compare, researchers need to rely on available national surveys.", "spanType": "span-simple-text"}], "parseErrors": []}, {"type": "text", "value": [{"text": "Such surveys are partly designed with cross-country comparability in mind, but because the surveys reflect the circumstances and priorities of individual countries at the time of the survey, there are some impo… | {"errors": [], "numBlocks": 39, "numErrors": 0, "wpTagCounts": {"heading": 7, "paragraph": 32}, "htmlTagCounts": {"p": 32, "h3": 1, "h4": 6}} | 2022-08-31 12:01:19 | 2024-02-16 14:23:03 | [null] | 2022-08-31 13:22:44 | 2023-02-03 09:22:16 | {} | All the data included in this explorer is available to download [in GitHub](https://github.com/owid/poverty-data), alongside a range of other poverty and inequality metrics. ## About this data ### Where is this data sourced from? This data explorer is collated and adapted from the World Bank’s [Poverty and Inequality Platform](https://pip.worldbank.org/home) (PIP). The World Bank’s PIP data is a large collection of household surveys where steps have been taken by the World Bank to harmonize definitions and methods across countries and over time. ### About the comparability of household surveys There is no global survey of incomes. To understand how incomes across the world compare, researchers need to rely on available national surveys. Such surveys are partly designed with cross-country comparability in mind, but because the surveys reflect the circumstances and priorities of individual countries at the time of the survey, there are some important differences. **Income vs expenditure surveys** One important issue is that the survey data included within the [PIP](https://pip.worldbank.org/home) database tends to measure people’s income in high-income countries, and people’s consumption expenditure in poorer countries. The two concepts are closely related: the income of a household equals their consumption plus any saving, or minus any borrowing or spending out of savings. One important difference is that, while zero consumption is not a feasible value – people with zero consumption would starve – a zero income is a feasible value. This means that, at the bottom end of the distribution, income and consumption can give quite different pictures about a person’s welfare. For instance, a person dissaving in retirement may have a very low, or even zero, income, but have a high level of consumption nevertheless. The gap between income and consumption is higher at the top of this distribution too, richer households tend to save more, meaning that the gap between income and consumption is higher at the top of… | {"data": {"wpBlock": {"content": "\n<p>All the data included in this explorer is available to download <a href=\"https://github.com/owid/poverty-data\">in GitHub</a>, alongside a range of other poverty and inequality metrics.</p>\n\n\n\n<h3>About this data</h3>\n\n\n\n<h4>Where is this data sourced from?</h4>\n\n\n\n<p>This data explorer is collated and adapted from the World Bank’s <a href=\"https://pip.worldbank.org/home\">Poverty and Inequality Platform</a> (PIP).</p>\n\n\n\n<p>The World Bank’s PIP data is a large collection of household surveys where steps have been taken by the World Bank to harmonize definitions and methods across countries and over time.</p>\n\n\n\n<h4>About the comparability of household surveys</h4>\n\n\n\n<p>There is no global survey of incomes. To understand how incomes across the world compare, researchers need to rely on available national surveys.</p>\n\n\n\n<p>Such surveys are partly designed with cross-country comparability in mind, but because the surveys reflect the circumstances and priorities of individual countries at the time of the survey, there are some important differences.</p>\n\n\n\n<p><strong>Income vs expenditure surveys</strong></p>\n\n\n\n<p>One important issue is that the survey data included within the <a href=\"https://pip.worldbank.org/home\">PIP</a> database tends to measure people’s income in high-income countries, and people’s consumption expenditure in poorer countries.</p>\n\n\n\n<p>The two concepts are closely related: the income of a household equals their consumption plus any saving, or minus any borrowing or spending out of savings. </p>\n\n\n\n<p>One important difference is that, while zero consumption is not a feasible value – people with zero consumption would starve – a zero income is a feasible value. This means that, at the bottom end of the distribution, income and consumption can give quite different pictures about a person’s welfare. For instance, a person dissaving in retirement may have a very low, or even zero, income, but have a high … | |||
| 1123 | 1123 | 52598 | The world has recently become less democratic | less-democratic | post | publish | <!-- wp-block-tombstone 52706 -->
<!-- wp:paragraph -->
<p><a href="https://ourworldindata.org/democratic-rights">Many more people than in the past have democratic rights</a>. But now there is growing concern that this progress is currently being partially undone.{ref}See for example:</p>
<!-- /wp:paragraph -->
<!-- wp:paragraph -->
<p>Lührmann, Anna, and Staffan Lindberg. 2019. A third wave of autocratization is here: what is new about it? Democratization 26(7): 1095-1113.</p>
<!-- /wp:paragraph -->
<!-- wp:paragraph -->
<p>Haggard, Stephan, and Robert Kaufman. 2021. The Anatomy of Democratic Backsliding. Journal of Democracy 32(4): 27-41.{/ref} Is this true? Has the world become less democratic recently?</p>
<!-- /wp:paragraph -->
<!-- wp:paragraph -->
<p>This article shows that the <a href="https://ourworldindata.org/democracies-measurement">leading approaches</a> to measuring democracy indicate that this is true: the world has become less democratic in recent years.</p>
<!-- /wp:paragraph -->
<!-- wp:paragraph -->
<p>Democracy is in decline, whether we look at big changes in the number of democracies and the people living in them; at small changes in the extent of democratic rights; or at medium-sized changes in the number of, and people living in, countries that are autocratizing.{ref}I use ‘autocratizing’ and ‘becoming less democratic’ as synonyms.{/ref}</p>
<!-- /wp:paragraph -->
<!-- wp:paragraph -->
<p>The extent of this decline is substantial, but it is also uncertain and limited. We can see it clearly across democracy metrics: the world has fallen from all-time democratic highs to a level similar to earlier decades. But the extent of this decline depends on which democracy measure we use. And it is limited in the sense that the world remains much more democratic than it was even half a century ago.</p>
<!-- /wp:paragraph -->
<!-- wp:paragraph -->
<p>Finally, the recent democratic decline is precedented, and past declines were reversed. The world underwent phases of autocratization in the 1930s an… |
{"id": "wp-52598", "slug": "less-democratic", "content": {"toc": [], "body": [{"type": "text", "value": [{"url": "https://ourworldindata.org/democratic-rights", "children": [{"text": "Many more people than in the past have democratic rights", "spanType": "span-simple-text"}], "spanType": "span-link"}, {"text": ". But now there is growing concern that this progress is currently being partially undone.{ref}See for example:", "spanType": "span-simple-text"}], "parseErrors": []}, {"type": "text", "value": [{"text": "Lührmann, Anna, and Staffan Lindberg. 2019. A third wave of autocratization is here: what is new about it? Democratization 26(7): 1095-1113.", "spanType": "span-simple-text"}], "parseErrors": []}, {"type": "text", "value": [{"text": "Haggard, Stephan, and Robert Kaufman. 2021. The Anatomy of Democratic Backsliding. Journal of Democracy 32(4): 27-41.{/ref} Is this true? Has the world become less democratic recently?", "spanType": "span-simple-text"}], "parseErrors": []}, {"type": "text", "value": [{"text": "This article shows that the ", "spanType": "span-simple-text"}, {"url": "https://ourworldindata.org/democracies-measurement", "children": [{"text": "leading approaches", "spanType": "span-simple-text"}], "spanType": "span-link"}, {"text": " to measuring democracy indicate that this is true: the world has become less democratic in recent years.", "spanType": "span-simple-text"}], "parseErrors": []}, {"type": "text", "value": [{"text": "Democracy is in decline, whether we look at big changes in the number of democracies and the people living in them; at small changes in the extent of democratic rights; or at medium-sized changes in the number of, and people living in, countries that are autocratizing.{ref}I use ‘autocratizing’ and ‘becoming less democratic’ as synonyms.{/ref}", "spanType": "span-simple-text"}], "parseErrors": []}, {"type": "text", "value": [{"text": "The extent of this decline is substantial, but it is also uncertain and limited. We can see it clearly across democracy metrics: the world h… | {"errors": [{"name": "prominent link missing title", "details": "Prominent link is missing a title attribute"}], "numBlocks": 60, "numErrors": 1, "wpTagCounts": {"html": 7, "heading": 8, "paragraph": 43, "owid/prominent-link": 4}, "htmlTagCounts": {"p": 43, "h4": 8, "iframe": 7}} | 2022-09-06 10:40:47 | 2024-02-16 14:22:54 | 14ThFloGyQv4uSGdEeZROWq_2yvHC9ggnAFij_9Oyz6g | ["Bastian Herre"] | Many more people have democratic rights than in the past. Some of this progress has recently been reversed. | 2022-08-30 13:32:38 | 2023-03-14 11:59:49 | https://ourworldindata.org/wp-content/uploads/2022/09/less-democratic2.png | {} | [Many more people than in the past have democratic rights](https://ourworldindata.org/democratic-rights). But now there is growing concern that this progress is currently being partially undone.{ref}See for example: Lührmann, Anna, and Staffan Lindberg. 2019. A third wave of autocratization is here: what is new about it? Democratization 26(7): 1095-1113. Haggard, Stephan, and Robert Kaufman. 2021. The Anatomy of Democratic Backsliding. Journal of Democracy 32(4): 27-41.{/ref} Is this true? Has the world become less democratic recently? This article shows that the [leading approaches](https://ourworldindata.org/democracies-measurement) to measuring democracy indicate that this is true: the world has become less democratic in recent years. Democracy is in decline, whether we look at big changes in the number of democracies and the people living in them; at small changes in the extent of democratic rights; or at medium-sized changes in the number of, and people living in, countries that are autocratizing.{ref}I use ‘autocratizing’ and ‘becoming less democratic’ as synonyms.{/ref} The extent of this decline is substantial, but it is also uncertain and limited. We can see it clearly across democracy metrics: the world has fallen from all-time democratic highs to a level similar to earlier decades. But the extent of this decline depends on which democracy measure we use. And it is limited in the sense that the world remains much more democratic than it was even half a century ago. Finally, the recent democratic decline is precedented, and past declines were reversed. The world underwent phases of autocratization in the 1930s and again in the 1960s and 1970s. Back then, people fought to turn the tide, and pushed democratic rights to unprecedented heights. We can do the same again. ## Recently, the number of democracies has declined… The simplest way to explore whether the world has recently become less democratic is by looking at how many countries are democracies. In the chart I rely on the [Regimes of the Wo… | {"id": 52598, "date": "2022-09-06T11:40:47", "guid": {"rendered": "https://owid.cloud/?p=52598"}, "link": "https://owid.cloud/less-democratic", "meta": {"owid_publication_context_meta_field": {"latest": true, "homepage": true, "immediate_newsletter": true}}, "slug": "less-democratic", "tags": [], "type": "post", "title": {"rendered": "The world has recently become less democratic"}, "_links": {"self": [{"href": "https://owid.cloud/wp-json/wp/v2/posts/52598"}], "about": [{"href": "https://owid.cloud/wp-json/wp/v2/types/post"}], "author": [{"href": "https://owid.cloud/wp-json/wp/v2/users/49", "embeddable": true}], "curies": [{"href": "https://api.w.org/{rel}", "name": "wp", "templated": true}], "replies": [{"href": "https://owid.cloud/wp-json/wp/v2/comments?post=52598", "embeddable": true}], "wp:term": [{"href": "https://owid.cloud/wp-json/wp/v2/categories?post=52598", "taxonomy": "category", "embeddable": true}, {"href": "https://owid.cloud/wp-json/wp/v2/tags?post=52598", "taxonomy": "post_tag", "embeddable": true}], "collection": [{"href": "https://owid.cloud/wp-json/wp/v2/posts"}], "wp:attachment": [{"href": "https://owid.cloud/wp-json/wp/v2/media?parent=52598"}], "version-history": [{"href": "https://owid.cloud/wp-json/wp/v2/posts/52598/revisions", "count": 24}], "wp:featuredmedia": [{"href": "https://owid.cloud/wp-json/wp/v2/media/52862", "embeddable": true}], "predecessor-version": [{"id": 52707, "href": "https://owid.cloud/wp-json/wp/v2/posts/52598/revisions/52707"}]}, "author": 49, "format": "standard", "status": "publish", "sticky": false, "content": {"rendered": "\n<p><a href=\"https://ourworldindata.org/democratic-rights\">Many more people than in the past have democratic rights</a>. But now there is growing concern that this progress is currently being partially undone.{ref}See for example:</p>\n\n\n\n<p>Lührmann, Anna, and Staffan Lindberg. 2019. A third wave of autocratization is here: what is new about it? Democratization 26(7): 1095-1113.</p>\n\n\n\n<p>Haggard, Stephan, and Robert Kaufman. 2021. The… |
| 1121 | 1121 | 52489 | We just published a new data explorer on the Environmental Impacts of Food | new-env-food-data-explorer | post | publish | {"id": "wp-52489", "slug": "new-env-food-data-explorer", "content": {"toc": [], "body": [], "type": "article", "title": "We just published a new data explorer on the Environmental Impacts of Food", "authors": ["Hannah Ritchie"], "excerpt": "Explore the environmental impacts of hundreds of specific food products.", "dateline": "August 17, 2022", "subtitle": "Explore the environmental impacts of hundreds of specific food products.", "sidebar-toc": false, "featured-image": "Env-Impacts-of-Food-Data-Explorer.png"}, "createdAt": "2022-08-15T16:00:06.000Z", "published": false, "updatedAt": "2022-08-17T10:38:21.000Z", "revisionId": null, "publishedAt": "2022-08-17T10:00:00.000Z", "relatedCharts": [], "publicationContext": "listed"} | {"errors": [], "numBlocks": 0, "numErrors": 0, "wpTagCounts": {}, "htmlTagCounts": {}} | 2022-08-17 10:00:00 | 2024-02-16 14:22:54 | ["Hannah Ritchie"] | Explore the environmental impacts of hundreds of specific food products. | 2022-08-15 16:00:06 | 2022-08-17 10:38:21 | https://ourworldindata.org/wp-content/uploads/2022/08/Env-Impacts-of-Food-Data-Explorer.png | {} | {"id": 52489, "date": "2022-08-17T11:00:00", "guid": {"rendered": "https://owid.cloud/?p=52489"}, "link": "https://owid.cloud/new-env-food-data-explorer", "meta": {"owid_publication_context_meta_field": {"latest": true, "homepage": true, "immediate_newsletter": true}}, "slug": "new-env-food-data-explorer", "tags": [], "type": "post", "title": {"rendered": "We just published a new data explorer on the Environmental Impacts of Food"}, "_links": {"self": [{"href": "https://owid.cloud/wp-json/wp/v2/posts/52489"}], "about": [{"href": "https://owid.cloud/wp-json/wp/v2/types/post"}], "author": [{"href": "https://owid.cloud/wp-json/wp/v2/users/17", "embeddable": true}], "curies": [{"href": "https://api.w.org/{rel}", "name": "wp", "templated": true}], "replies": [{"href": "https://owid.cloud/wp-json/wp/v2/comments?post=52489", "embeddable": true}], "wp:term": [{"href": "https://owid.cloud/wp-json/wp/v2/categories?post=52489", "taxonomy": "category", "embeddable": true}, {"href": "https://owid.cloud/wp-json/wp/v2/tags?post=52489", "taxonomy": "post_tag", "embeddable": true}], "collection": [{"href": "https://owid.cloud/wp-json/wp/v2/posts"}], "wp:attachment": [{"href": "https://owid.cloud/wp-json/wp/v2/media?parent=52489"}], "version-history": [{"href": "https://owid.cloud/wp-json/wp/v2/posts/52489/revisions", "count": 2}], "wp:featuredmedia": [{"href": "https://owid.cloud/wp-json/wp/v2/media/52488", "embeddable": true}], "predecessor-version": [{"id": 52493, "href": "https://owid.cloud/wp-json/wp/v2/posts/52489/revisions/52493"}]}, "author": 17, "format": "standard", "status": "publish", "sticky": false, "content": {"rendered": "", "protected": false}, "excerpt": {"rendered": "Explore the environmental impacts of hundreds of specific food products.", "protected": false}, "date_gmt": "2022-08-17T10:00:00", "modified": "2022-08-17T11:38:21", "template": "", "categories": [1], "ping_status": "closed", "authors_name": ["Hannah Ritchie"], "modified_gmt": "2022-08-17T10:38:21", "comment_status": "closed", "featured_media": 5248… | |||
| 1120 | 1120 | 52472 | Text for Plastic Pollution Explorer | text-for-plastic-pollution-explorer | wp_block | publish | <!-- wp:heading -->
<h2>Explore more of our work on Plastic Pollution</h2>
<!-- /wp:heading -->
<!-- wp:owid/prominent-link {"title":"","linkUrl":"https://ourworldindata.org/plastic-pollution","className":"is-style-thin"} -->
<!-- wp:paragraph -->
<p></p>
<!-- /wp:paragraph -->
<!-- /wp:owid/prominent-link -->
<!-- wp:owid/prominent-link {"title":"","linkUrl":"https://ourworldindata.org/ocean-plastics","className":"is-style-thin"} /-->
<!-- wp:owid/prominent-link {"title":"","linkUrl":"https://ourworldindata.org/grapher/global-plastics-production","className":"is-style-thin"} -->
<!-- wp:paragraph -->
<p></p>
<!-- /wp:paragraph -->
<!-- /wp:owid/prominent-link --> |
{"id": "wp-52472", "slug": "text-for-plastic-pollution-explorer", "content": {"toc": [], "body": [{"text": [{"text": "Explore more of our work on Plastic Pollution", "spanType": "span-simple-text"}], "type": "heading", "level": 2, "parseErrors": []}, {"url": "https://ourworldindata.org/plastic-pollution", "type": "prominent-link", "title": "", "description": "", "parseErrors": []}, {"url": "https://ourworldindata.org/ocean-plastics", "type": "prominent-link", "title": "", "description": "", "parseErrors": []}, {"url": "https://ourworldindata.org/grapher/global-plastics-production", "type": "prominent-link", "title": "", "description": "", "parseErrors": []}], "type": "article", "title": "Text for Plastic Pollution Explorer", "authors": [null], "dateline": "August 10, 2022", "sidebar-toc": false, "featured-image": ""}, "createdAt": "2022-08-10T12:46:40.000Z", "published": false, "updatedAt": "2022-08-10T12:46:40.000Z", "revisionId": null, "publishedAt": "2022-08-10T12:46:40.000Z", "relatedCharts": [], "publicationContext": "listed"} | {"errors": [], "numBlocks": 4, "numErrors": 0, "wpTagCounts": {"heading": 1, "paragraph": 2, "owid/prominent-link": 3}, "htmlTagCounts": {"p": 2, "h2": 1}} | 2022-08-10 12:46:40 | 2024-02-16 14:23:03 | [null] | 2022-08-10 12:46:40 | {} | ## Explore more of our work on Plastic Pollution ### https://ourworldindata.org/plastic-pollution ### https://ourworldindata.org/ocean-plastics ### https://ourworldindata.org/grapher/global-plastics-production | {"data": {"wpBlock": {"content": "\n<h2>Explore more of our work on Plastic Pollution</h2>\n\n\n <block type=\"prominent-link\" style=\"is-style-thin\">\n <link-url>https://ourworldindata.org/plastic-pollution</link-url>\n <title></title>\n <content>\n\n<p></p>\n\n</content>\n <figure></figure>\n </block>\n\n <block type=\"prominent-link\" style=\"is-style-thin\">\n <link-url>https://ourworldindata.org/ocean-plastics</link-url>\n <title></title>\n <content></content>\n <figure></figure>\n </block>\n\n <block type=\"prominent-link\" style=\"is-style-thin\">\n <link-url>https://ourworldindata.org/grapher/global-plastics-production</link-url>\n <title></title>\n <content>\n\n<p></p>\n\n</content>\n <figure></figure>\n </block>"}}, "extensions": {"debug": [{"type": "DEBUG_LOGS_INACTIVE", "message": "GraphQL Debug logging is not active. To see debug logs, GRAPHQL_DEBUG must be enabled."}]}} | ||||
| 1119 | 1119 | 52465 | We just published our Air Pollution Data Explorer | launch-air-pollution-explorer | post | publish | {"id": "wp-52465", "slug": "launch-air-pollution-explorer", "content": {"toc": [], "body": [], "type": "article", "title": "We just published our Air Pollution Data Explorer", "authors": ["Hannah Ritchie"], "excerpt": "Explore historical and recent emissions of air pollutants across the world.", "dateline": "August 11, 2022", "subtitle": "Explore historical and recent emissions of air pollutants across the world.", "sidebar-toc": false, "featured-image": "Air-Pollution-Data-Explorer.png"}, "createdAt": "2022-08-10T12:24:23.000Z", "published": false, "updatedAt": "2022-08-11T11:15:01.000Z", "revisionId": null, "publishedAt": "2022-08-11T10:30:00.000Z", "relatedCharts": [], "publicationContext": "listed"} | {"errors": [], "numBlocks": 0, "numErrors": 0, "wpTagCounts": {}, "htmlTagCounts": {}} | 2022-08-11 10:30:00 | 2024-02-16 14:22:54 | ["Hannah Ritchie"] | Explore historical and recent emissions of air pollutants across the world. | 2022-08-10 12:24:23 | 2022-08-11 11:15:01 | https://ourworldindata.org/wp-content/uploads/2022/08/Air-Pollution-Data-Explorer.png | {} | {"id": 52465, "date": "2022-08-11T11:30:00", "guid": {"rendered": "https://owid.cloud/?p=52465"}, "link": "https://owid.cloud/launch-air-pollution-explorer", "meta": {"owid_publication_context_meta_field": {"latest": true, "homepage": true, "immediate_newsletter": true}}, "slug": "launch-air-pollution-explorer", "tags": [], "type": "post", "title": {"rendered": "We just published our Air Pollution Data Explorer"}, "_links": {"self": [{"href": "https://owid.cloud/wp-json/wp/v2/posts/52465"}], "about": [{"href": "https://owid.cloud/wp-json/wp/v2/types/post"}], "author": [{"href": "https://owid.cloud/wp-json/wp/v2/users/17", "embeddable": true}], "curies": [{"href": "https://api.w.org/{rel}", "name": "wp", "templated": true}], "replies": [{"href": "https://owid.cloud/wp-json/wp/v2/comments?post=52465", "embeddable": true}], "wp:term": [{"href": "https://owid.cloud/wp-json/wp/v2/categories?post=52465", "taxonomy": "category", "embeddable": true}, {"href": "https://owid.cloud/wp-json/wp/v2/tags?post=52465", "taxonomy": "post_tag", "embeddable": true}], "collection": [{"href": "https://owid.cloud/wp-json/wp/v2/posts"}], "wp:attachment": [{"href": "https://owid.cloud/wp-json/wp/v2/media?parent=52465"}], "version-history": [{"href": "https://owid.cloud/wp-json/wp/v2/posts/52465/revisions", "count": 2}], "wp:featuredmedia": [{"href": "https://owid.cloud/wp-json/wp/v2/media/52464", "embeddable": true}], "predecessor-version": [{"id": 52468, "href": "https://owid.cloud/wp-json/wp/v2/posts/52465/revisions/52468"}]}, "author": 17, "format": "standard", "status": "publish", "sticky": false, "content": {"rendered": "", "protected": false}, "excerpt": {"rendered": "Explore historical and recent emissions of air pollutants across the world.", "protected": false}, "date_gmt": "2022-08-11T10:30:00", "modified": "2022-08-11T12:15:01", "template": "", "categories": [1], "ping_status": "closed", "authors_name": ["Hannah Ritchie"], "modified_gmt": "2022-08-11T11:15:01", "comment_status": "closed", "featured_media": 52464, "featured_med… | |||
| 1118 | 1118 | 52429 | Text for Air Pollution Explorer | text-for-air-pollution-explorer | wp_block | publish | <!-- wp:heading {"level":3} -->
<h3>Explore more of our work on Air Pollution</h3>
<!-- /wp:heading -->
<!-- wp:owid/prominent-link {"title":"","linkUrl":"https://ourworldindata.org/air-pollution","className":"is-style-thin"} -->
<!-- wp:paragraph -->
<p></p>
<!-- /wp:paragraph -->
<!-- /wp:owid/prominent-link -->
<!-- wp:owid/prominent-link {"title":"","linkUrl":"https://ourworldindata.org/data-review-air-pollution-deaths","className":"is-style-thin"} /-->
<!-- wp:owid/prominent-link {"title":"","linkUrl":"https://ourworldindata.org/energy-poverty-air-pollution","className":"is-style-thin"} -->
<!-- wp:paragraph -->
<p></p>
<!-- /wp:paragraph -->
<!-- /wp:owid/prominent-link --> |
{"id": "wp-52429", "slug": "text-for-air-pollution-explorer", "content": {"toc": [], "body": [{"text": [{"text": "Explore more of our work on Air Pollution", "spanType": "span-simple-text"}], "type": "heading", "level": 2, "parseErrors": []}, {"url": "https://ourworldindata.org/air-pollution", "type": "prominent-link", "title": "", "description": "", "parseErrors": []}, {"url": "https://ourworldindata.org/data-review-air-pollution-deaths", "type": "prominent-link", "title": "", "description": "", "parseErrors": []}, {"url": "https://ourworldindata.org/energy-poverty-air-pollution", "type": "prominent-link", "title": "", "description": "", "parseErrors": []}], "type": "article", "title": "Text for Air Pollution Explorer", "authors": [null], "dateline": "August 8, 2022", "sidebar-toc": false, "featured-image": ""}, "createdAt": "2022-08-08T11:15:09.000Z", "published": false, "updatedAt": "2022-08-08T11:15:09.000Z", "revisionId": null, "publishedAt": "2022-08-08T11:15:09.000Z", "relatedCharts": [], "publicationContext": "listed"} | {"errors": [], "numBlocks": 4, "numErrors": 0, "wpTagCounts": {"heading": 1, "paragraph": 2, "owid/prominent-link": 3}, "htmlTagCounts": {"p": 2, "h3": 1}} | 2022-08-08 11:15:09 | 2024-02-16 14:23:03 | [null] | 2022-08-08 11:15:09 | {} | ## Explore more of our work on Air Pollution ### https://ourworldindata.org/air-pollution ### https://ourworldindata.org/data-review-air-pollution-deaths ### https://ourworldindata.org/energy-poverty-air-pollution | {"data": {"wpBlock": {"content": "\n<h3>Explore more of our work on Air Pollution</h3>\n\n\n <block type=\"prominent-link\" style=\"is-style-thin\">\n <link-url>https://ourworldindata.org/air-pollution</link-url>\n <title></title>\n <content>\n\n<p></p>\n\n</content>\n <figure></figure>\n </block>\n\n <block type=\"prominent-link\" style=\"is-style-thin\">\n <link-url>https://ourworldindata.org/data-review-air-pollution-deaths</link-url>\n <title></title>\n <content></content>\n <figure></figure>\n </block>\n\n <block type=\"prominent-link\" style=\"is-style-thin\">\n <link-url>https://ourworldindata.org/energy-poverty-air-pollution</link-url>\n <title></title>\n <content>\n\n<p></p>\n\n</content>\n <figure></figure>\n </block>"}}, "extensions": {"debug": [{"type": "DEBUG_LOGS_INACTIVE", "message": "GraphQL Debug logging is not active. To see debug logs, GRAPHQL_DEBUG must be enabled."}]}} | ||||
| 1117 | 1117 | 52428 | Text for Environmental Impacts of Food Explorer | text-for-environmental-impacts-of-food-explorer-2 | wp_block | publish | <!-- wp:heading {"level":3} -->
<h3>Explore more of our work on the Environmental Impacts of Food</h3>
<!-- /wp:heading -->
<!-- wp:owid/prominent-link {"title":"","linkUrl":"https://ourworldindata.org/environmental-impacts-of-food","className":"is-style-thin"} -->
<!-- wp:paragraph -->
<p></p>
<!-- /wp:paragraph -->
<!-- /wp:owid/prominent-link -->
<!-- wp:owid/prominent-link {"title":"","linkUrl":"https://ourworldindata.org/environmental-impact-milks","className":"is-style-thin"} -->
<!-- wp:paragraph -->
<p></p>
<!-- /wp:paragraph -->
<!-- /wp:owid/prominent-link -->
<!-- wp:owid/prominent-link {"title":"","linkUrl":"https://ourworldindata.org/food-choice-vs-eating-local","className":"is-style-thin"} /--> |
{"id": "wp-52428", "slug": "text-for-environmental-impacts-of-food-explorer-2", "content": {"toc": [], "body": [{"text": [{"text": "Explore more of our work on the Environmental Impacts of Food", "spanType": "span-simple-text"}], "type": "heading", "level": 2, "parseErrors": []}, {"url": "https://ourworldindata.org/environmental-impacts-of-food", "type": "prominent-link", "title": "", "description": "", "parseErrors": []}, {"url": "https://ourworldindata.org/environmental-impact-milks", "type": "prominent-link", "title": "", "description": "", "parseErrors": []}, {"url": "https://ourworldindata.org/food-choice-vs-eating-local", "type": "prominent-link", "title": "", "description": "", "parseErrors": []}], "type": "article", "title": "Text for Environmental Impacts of Food Explorer", "authors": [null], "dateline": "August 8, 2022", "sidebar-toc": false, "featured-image": ""}, "createdAt": "2022-08-08T10:51:55.000Z", "published": false, "updatedAt": "2022-08-08T10:51:55.000Z", "revisionId": null, "publishedAt": "2022-08-08T10:51:55.000Z", "relatedCharts": [], "publicationContext": "listed"} | {"errors": [], "numBlocks": 4, "numErrors": 0, "wpTagCounts": {"heading": 1, "paragraph": 2, "owid/prominent-link": 3}, "htmlTagCounts": {"p": 2, "h3": 1}} | 2022-08-08 10:51:55 | 2024-02-16 14:23:03 | [null] | 2022-08-08 10:51:55 | {} | ## Explore more of our work on the Environmental Impacts of Food ### https://ourworldindata.org/environmental-impacts-of-food ### https://ourworldindata.org/environmental-impact-milks ### https://ourworldindata.org/food-choice-vs-eating-local | {"data": {"wpBlock": {"content": "\n<h3>Explore more of our work on the Environmental Impacts of Food</h3>\n\n\n <block type=\"prominent-link\" style=\"is-style-thin\">\n <link-url>https://ourworldindata.org/environmental-impacts-of-food</link-url>\n <title></title>\n <content>\n\n<p></p>\n\n</content>\n <figure></figure>\n </block>\n\n <block type=\"prominent-link\" style=\"is-style-thin\">\n <link-url>https://ourworldindata.org/environmental-impact-milks</link-url>\n <title></title>\n <content>\n\n<p></p>\n\n</content>\n <figure></figure>\n </block>\n\n <block type=\"prominent-link\" style=\"is-style-thin\">\n <link-url>https://ourworldindata.org/food-choice-vs-eating-local</link-url>\n <title></title>\n <content></content>\n <figure></figure>\n </block>"}}, "extensions": {"debug": [{"type": "DEBUG_LOGS_INACTIVE", "message": "GraphQL Debug logging is not active. To see debug logs, GRAPHQL_DEBUG must be enabled."}]}} | ||||
| 1116 | 1116 | 52306 | Countries around the world have become much more democratic, but there are large differences between them | countries-around-the-world-have-become-much-more-democratic-but-there-are-large-differences-between-them | wp_block | publish | <!-- wp:paragraph -->
<p>200 years ago, everyone lacked democratic rights. Now, <a href="https://ourworldindata.org/democratic-rights">billions of people have them</a>.</p>
<!-- /wp:paragraph -->
<!-- wp:paragraph -->
<p>But there are still large differences in the degree to which citizens enjoy political rights: most clearly between democracies and non-democracies, but also <em>within</em> these broad political regimes.</p>
<!-- /wp:paragraph -->
<!-- wp:paragraph -->
<p>To understand the extent of people’s political rights, we shouldn’t only look at whether a country is classified as a democracy or not. We should also look at smaller differences in <em>how democratic</em> countries are.</p>
<!-- /wp:paragraph -->
<!-- wp:paragraph -->
<p>How democratic have countries been across the world? And how big are the differences between them?</p>
<!-- /wp:paragraph -->
<!-- wp:paragraph -->
<p>To answer these questions, we need information on countries’ political systems over recent centuries.</p>
<!-- /wp:paragraph -->
<!-- wp:heading {"level":4} -->
<h4>How can researchers measure how democratic a country is?</h4>
<!-- /wp:heading -->
<!-- wp:paragraph -->
<p>Measuring how democratic countries are comes with many challenges. People do not always agree on what characteristics define a democracy. Its characteristics — such as whether an election was free and fair — are difficult to assess. The assessments of experts are to some degree subjective and they may disagree; either about a specific characteristic, or how several characteristics can be reduced into a single measure of democracy.</p>
<!-- /wp:paragraph -->
<!-- wp:paragraph -->
<p>Because of these difficulties, classifying political systems is unavoidably controversial. I have written more about how researchers deal with the challenges of measuring democracy <a href="https://ourworldindata.org/democracies-measurement">in another article</a>.</p>
<!-- /wp:paragraph -->
<!-- wp:paragraph -->
<p>The source we show here is the electoral democracy index fr… |
{"id": "wp-52306", "slug": "countries-around-the-world-have-become-much-more-democratic-but-there-are-large-differences-between-them", "content": {"toc": [], "body": [{"type": "text", "value": [{"text": "200 years ago, everyone lacked democratic rights. Now, ", "spanType": "span-simple-text"}, {"url": "https://ourworldindata.org/democratic-rights", "children": [{"text": "billions of people have them", "spanType": "span-simple-text"}], "spanType": "span-link"}, {"text": ".", "spanType": "span-simple-text"}], "parseErrors": []}, {"type": "text", "value": [{"text": "But there are still large differences in the degree to which citizens enjoy political rights: most clearly between democracies and non-democracies, but also ", "spanType": "span-simple-text"}, {"children": [{"text": "within", "spanType": "span-simple-text"}], "spanType": "span-italic"}, {"text": " these broad political regimes.", "spanType": "span-simple-text"}], "parseErrors": []}, {"type": "text", "value": [{"text": "To understand the extent of people’s political rights, we shouldn’t only look at whether a country is classified as a democracy or not. We should also look at smaller differences in ", "spanType": "span-simple-text"}, {"children": [{"text": "how democratic", "spanType": "span-simple-text"}], "spanType": "span-italic"}, {"text": " countries are.", "spanType": "span-simple-text"}], "parseErrors": []}, {"type": "text", "value": [{"text": "How democratic have countries been across the world? And how big are the differences between them?", "spanType": "span-simple-text"}], "parseErrors": []}, {"type": "text", "value": [{"text": "To answer these questions, we need information on countries’ political systems over recent centuries.", "spanType": "span-simple-text"}], "parseErrors": []}, {"text": [{"text": "How can researchers measure how democratic a country is?", "spanType": "span-simple-text"}], "type": "heading", "level": 2, "parseErrors": []}, {"type": "text", "value": [{"text": "Measuring how democratic countries are comes with many challenge… | {"errors": [], "numBlocks": 61, "numErrors": 0, "wpTagCounts": {"html": 10, "heading": 7, "paragraph": 44, "owid/prominent-link": 1}, "htmlTagCounts": {"p": 44, "h4": 7, "iframe": 10}} | 2022-07-19 16:46:30 | 2024-02-16 14:23:03 | [null] | 2022-10-05 19:25:44 | 2023-07-20 13:09:40 | {} | 200 years ago, everyone lacked democratic rights. Now, [billions of people have them](https://ourworldindata.org/democratic-rights). But there are still large differences in the degree to which citizens enjoy political rights: most clearly between democracies and non-democracies, but also _within_ these broad political regimes. To understand the extent of people’s political rights, we shouldn’t only look at whether a country is classified as a democracy or not. We should also look at smaller differences in _how democratic_ countries are. How democratic have countries been across the world? And how big are the differences between them? To answer these questions, we need information on countries’ political systems over recent centuries. ## How can researchers measure how democratic a country is? Measuring how democratic countries are comes with many challenges. People do not always agree on what characteristics define a democracy. Its characteristics — such as whether an election was free and fair — are difficult to assess. The assessments of experts are to some degree subjective and they may disagree; either about a specific characteristic, or how several characteristics can be reduced into a single measure of democracy. Because of these difficulties, classifying political systems is unavoidably controversial. I have written more about how researchers deal with the challenges of measuring democracy [in another article](https://ourworldindata.org/democracies-measurement). The source we show here is the electoral democracy index from the Varieties of Democracy (V-Dem) project{ref}Coppedge, Michael, John Gerring, Carl Henrik Knutsen, Staffan I. Lindberg, Jan Teorell, David Altman, Michael Bernhard, Agnes Cornell, M. Steven Fish, Lisa Gastaldi, Haakon Gjerløw, Adam Glynn, Ana Good God, Sandra Grahn, Allen Hicken, Katrin Kinzelbach, Joshua Krusell, Kyle L. Marquardt, Kelly McMann, Valeriya Mechkova, Juraj Medzihorsky, Natalia Natsika, Anja Neundorf, Pamela Paxton, Daniel Pemstein, Josefine Pernes, Oskar Rydén… | {"data": {"wpBlock": {"content": "\n<p>200 years ago, everyone lacked democratic rights. Now, <a href=\"https://ourworldindata.org/democratic-rights\">billions of people have them</a>.</p>\n\n\n\n<p>But there are still large differences in the degree to which citizens enjoy political rights: most clearly between democracies and non-democracies, but also <em>within</em> these broad political regimes.</p>\n\n\n\n<p>To understand the extent of people’s political rights, we shouldn’t only look at whether a country is classified as a democracy or not. We should also look at smaller differences in <em>how democratic</em> countries are.</p>\n\n\n\n<p>How democratic have countries been across the world? And how big are the differences between them?</p>\n\n\n\n<p>To answer these questions, we need information on countries’ political systems over recent centuries.</p>\n\n\n\n<h4>How can researchers measure how democratic a country is?</h4>\n\n\n\n<p>Measuring how democratic countries are comes with many challenges. People do not always agree on what characteristics define a democracy. Its characteristics — such as whether an election was free and fair — are difficult to assess. The assessments of experts are to some degree subjective and they may disagree; either about a specific characteristic, or how several characteristics can be reduced into a single measure of democracy.</p>\n\n\n\n<p>Because of these difficulties, classifying political systems is unavoidably controversial. I have written more about how researchers deal with the challenges of measuring democracy <a href=\"https://ourworldindata.org/democracies-measurement\">in another article</a>.</p>\n\n\n\n<p>The source we show here is the electoral democracy index from the Varieties of Democracy (V-Dem) project{ref}Coppedge, Michael, John Gerring, Carl Henrik Knutsen, Staffan I. Lindberg, Jan Teorell, David Altman, Michael Bernhard, Agnes Cornell, M. Steven Fish, Lisa Gastaldi, Haakon Gjerløw, Adam Glynn, Ana Good God, Sandra Grahn, Allen Hicken, Katrin Kinzelbac… | |||
| 1115 | 1115 | 52216 | Block for Population Explorer | block-for-population-explorer | wp_block | publish | <!-- wp:heading {"level":4} -->
<h4>Explore more of our work on <em>Our World in Data</em></h4>
<!-- /wp:heading -->
<!-- wp:owid/prominent-link {"title":"","linkUrl":"https://ourworldindata.org/world-population-update-2022","className":"is-style-thin"} /--> |
{"id": "wp-52216", "slug": "block-for-population-explorer", "content": {"toc": [], "body": [{"text": [{"text": "Explore more of our work on ", "spanType": "span-simple-text"}, {"children": [{"text": "Our World in Data", "spanType": "span-simple-text"}], "spanType": "span-italic"}], "type": "heading", "level": 2, "parseErrors": []}, {"url": "https://ourworldindata.org/world-population-update-2022", "type": "prominent-link", "title": "", "description": "", "parseErrors": []}], "type": "article", "title": "Block for Population Explorer", "authors": [null], "dateline": "July 11, 2022", "sidebar-toc": false, "featured-image": ""}, "createdAt": "2022-07-11T15:30:52.000Z", "published": false, "updatedAt": "2022-07-11T15:30:52.000Z", "revisionId": null, "publishedAt": "2022-07-11T15:30:52.000Z", "relatedCharts": [], "publicationContext": "listed"} | {"errors": [], "numBlocks": 2, "numErrors": 0, "wpTagCounts": {"heading": 1, "owid/prominent-link": 1}, "htmlTagCounts": {"h4": 1}} | 2022-07-11 15:30:52 | 2024-07-12 08:58:45 | [null] | 2022-07-11 15:30:52 | {} | ## Explore more of our work on _Our World in Data_ ### https://ourworldindata.org/world-population-update-2022 | {"data": {"wpBlock": {"content": "<h4>Explore more of our work on <em>Our World in Data</em></h4>\n<div class='wp-block-owid-prominent-link with-image' data-no-lightbox='true' data-style='is-style-thin'\n data-title='Peak population, and other key findings from the 2024 UN Population Prospects'><a\n href='https://ourworldindata.org/un-population-2024-revision'>\n <figure><img src='https://ourworldindata.org/images/published/un-population-featured-image.png'></figure>\n <div class='content-wrapper'>\n <div class='title'><span>Peak population, and other key findings from the 2024 UN Population\n Prospects</span><svg aria-hidden='true' focusable='false' data-prefix='fas' data-icon='arrow-right'\n class='svg-inline--fa fa-arrow-right ' role='img' xmlns='http://www.w3.org/2000/svg'\n viewBox='0 0 448 512'>\n <path fill='currentColor'\n d='M438.6 278.6c12.5-12.5 12.5-32.8 0-45.3l-160-160c-12.5-12.5-32.8-12.5-45.3 0s-12.5 32.8 0 45.3L338.8 224 32 224c-17.7 0-32 14.3-32 32s14.3 32 32 32l306.7 0L233.4 393.4c-12.5 12.5-12.5 32.8 0 45.3s32.8 12.5 45.3 0l160-160z'>\n </path>\n </svg></div>\n </div>\n </a>\n</div>"}}, "extensions": {"debug": [{"type": "DEBUG_LOGS_INACTIVE", "message": "GraphQL Debug logging is not active. To see debug logs, GRAPHQL_DEBUG must be enabled."}]}} |
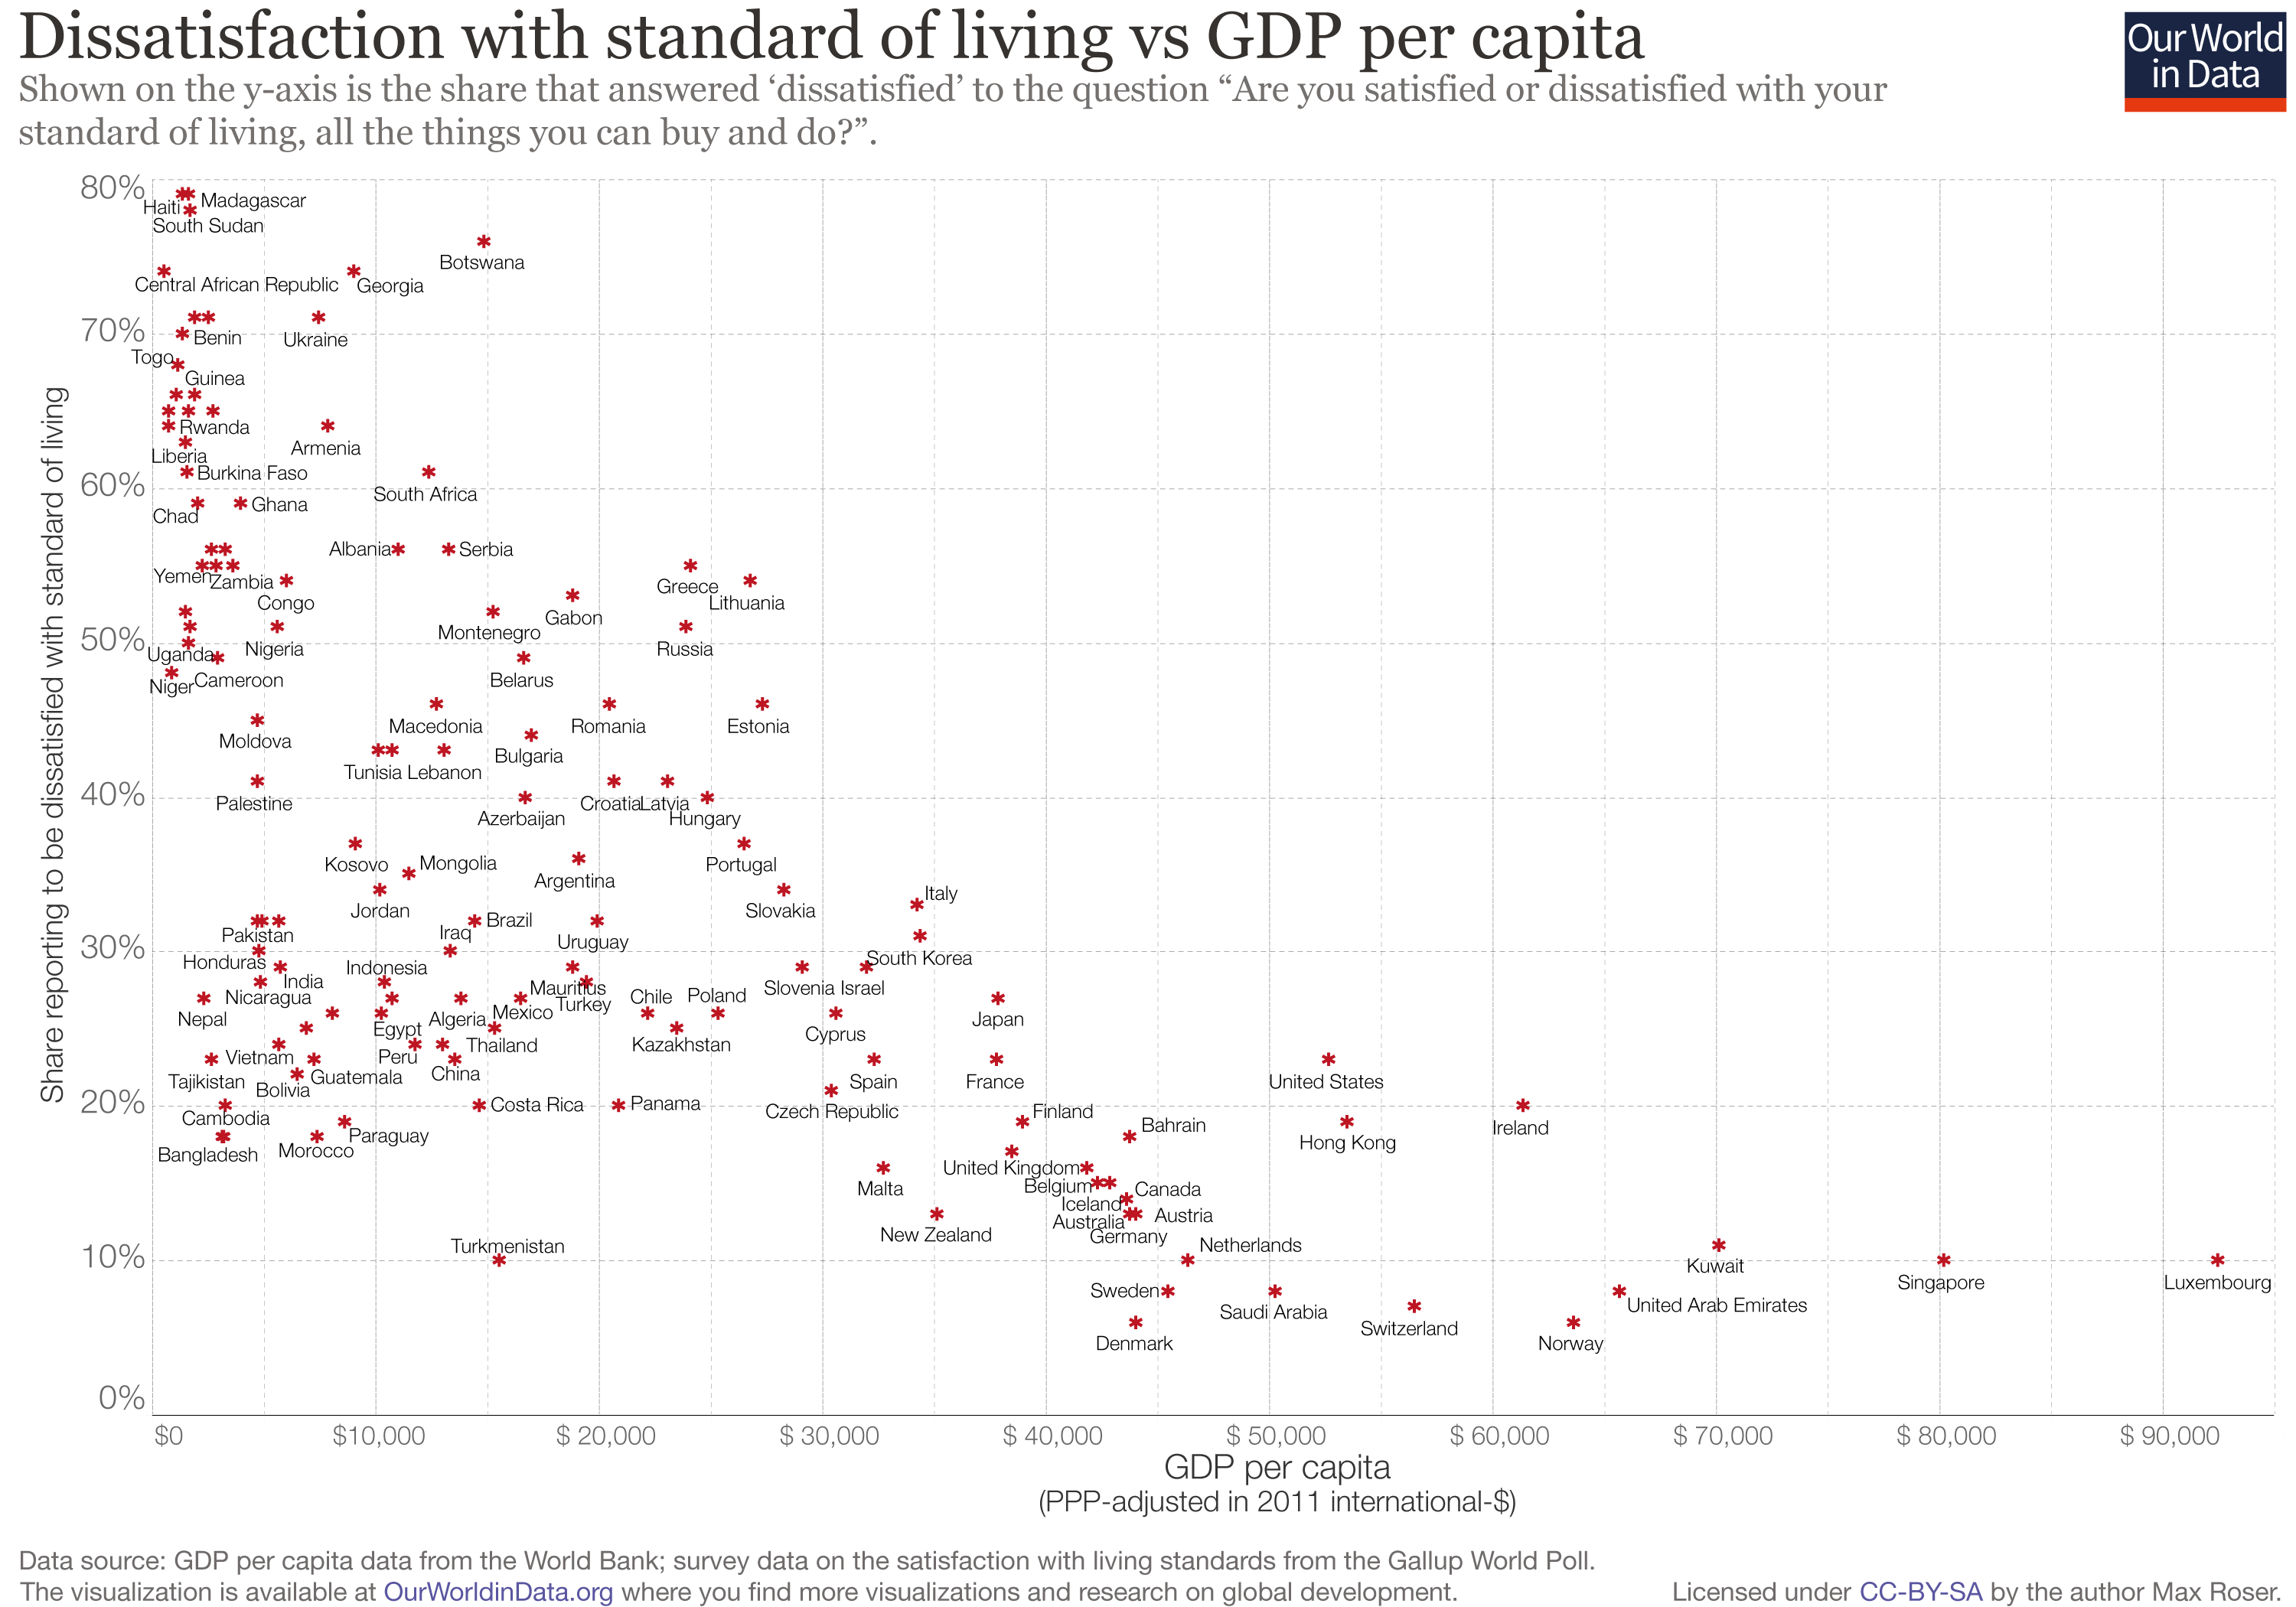
Advanced export
JSON shape: default, array, newline-delimited
CREATE TABLE posts(id INTEGER, title VARCHAR, slug VARCHAR, "type" VARCHAR, status VARCHAR, "content" VARCHAR, archieml VARCHAR, archieml_update_statistics VARCHAR, published_at TIMESTAMP, updated_at TIMESTAMP, gdocSuccessorId VARCHAR, authors VARCHAR, excerpt VARCHAR, created_at_in_wordpress TIMESTAMP, updated_at_in_wordpress TIMESTAMP, featured_image VARCHAR, formattingOptions VARCHAR, markdown VARCHAR, wpApiSnapshot VARCHAR);;